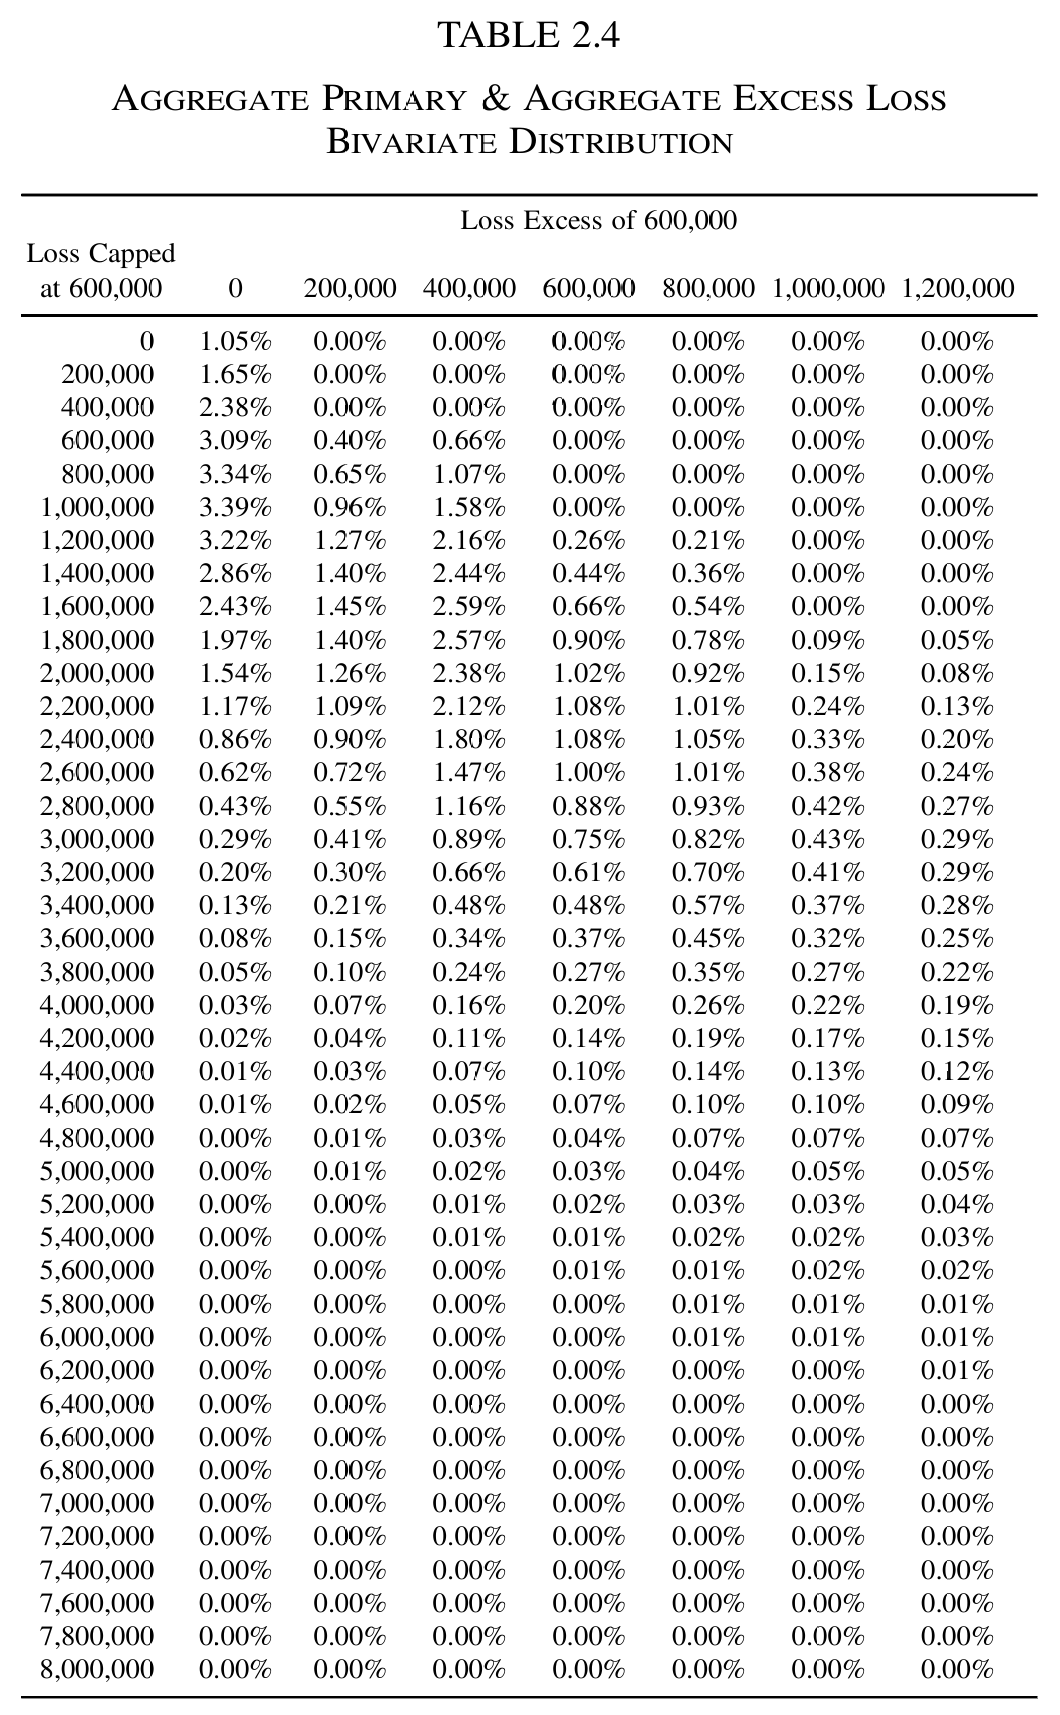
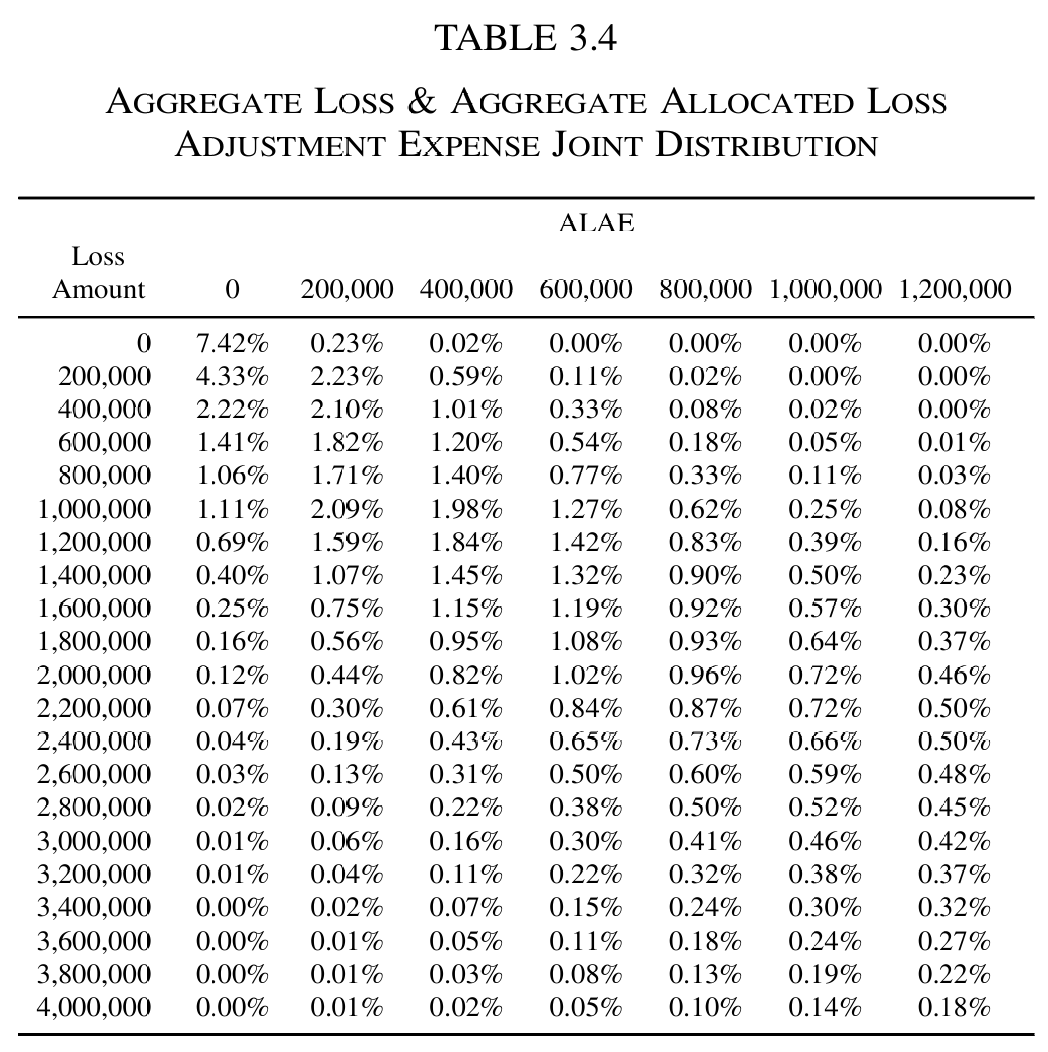
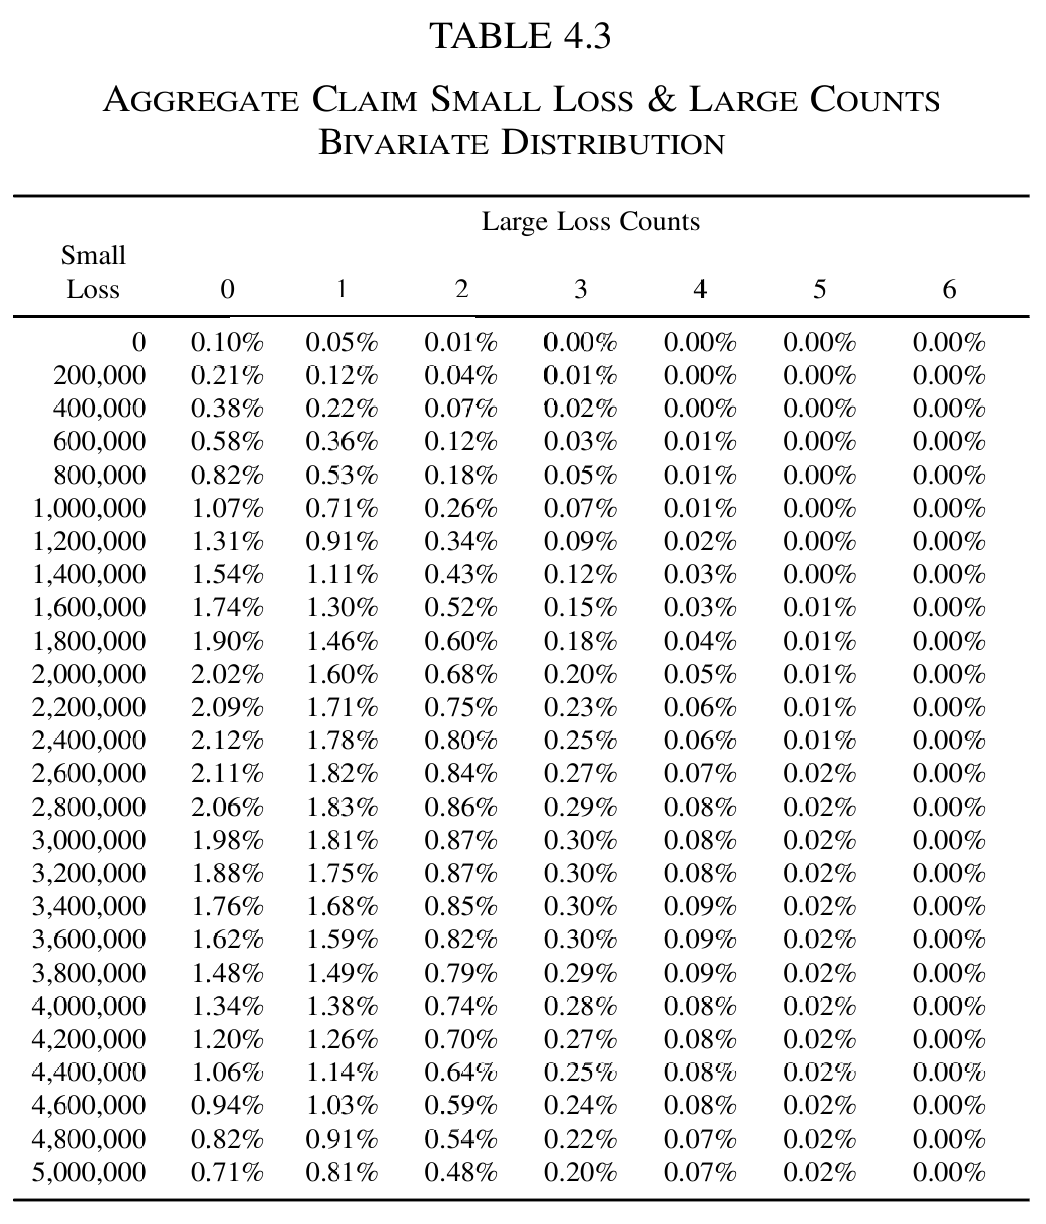
T24 = {0: [1.05, 0, 0, 0, 0, 0, 0], 200_000: [1.65, 0, 0, 0, 0, 0, 0],
       400_000: [2.38, 0, 0, 0, 0, 0, 0],
       600_000: [3.09, .40, .66, 0, 0, 0, 0],
       800_000: [3.34, .65, 1.07, 0, 0, 0, 0],
       1_000_000: [3.39, .96, 1.58, 0, 0, 0, 0],
       1_200_000: [3.22, 1.27, 2.16, .26, .21, 0, 0],
       1_400_000: [2.86, 1.40, 2.44, .44, .36, 0, 0],
       1_600_000: [2.43, 1.45, 2.59, .66, .54, 0, 0],
       1_800_000: [1.97, 1.40, 2.57, .90, .78, .09, .05],
       2_000_000: [1.54, 1.26, 2.38, 1.02, .92, .15, .08],
       2_200_000: [1.17, 1.09, 2.12, 1.08, 1.01, .24, .13],
       2_400_000: [.86, .90, 1.80, 1.08, 1.05, .33, .20],
       2_600_000: [.62, .72, 1.47, 1.00, 1.01, .38, .24],
       2_800_000: [.43, .55, 1.16, .88, .93, .42, .27],
       3_000_000: [.29, .41, .89, .75, .82, .43, .29],
       3_200_000: [.20, .30, .66, .61, .70, .41, .29],
       3_400_000: [.13, .21, .48, .48, .57, .37, .28],
       3_600_000: [.08, .15, .34, .37, .45, .32, .25],
       3_800_000: [.05, .10, .24, .27, .35, .27, .22],
       4_000_000: [.03, .07, .16, .20, .26, .22, .19],
       4_200_000: [.02, .04, .11, .14, .19, .17, .15],
       4_400_000: [.01, .03, .07, .10, .14, .13, .12],
       4_600_000: [.01, .02, .05, .07, .10, .10, .09],
       4_800_000: [0, .01, .03, .04, .07, .07, .07],
       5_000_000: [0, .01, .02, .03, .04, .05, .05]}
got24 = np.array([100 * d[int(round(r / K)), :7] for r in T24])
pap24 = np.array(list(T24.values()))
GT(pd.DataFrame(got24, index=[f'{r:,.0f}' for r in T24],
                columns=[f'{int(j * K):,.0f}' for j in range(7)]),
   float_format=2)
6 Comments
6.1 This is the paper
aggregatewas waiting forEvery construction in it maps onto a shipped DecL form, as Table 18 shows.
netceded agg ... occurrence net of 400000 xs 600000, orAggregate.occ_bivariatebivariate ... dbvsev [xs] [ys] [[rows]]bs=(200000, 1)bivariate ... dfreq [2] dbvsev ...Section 2 is the sharpest of the three, because
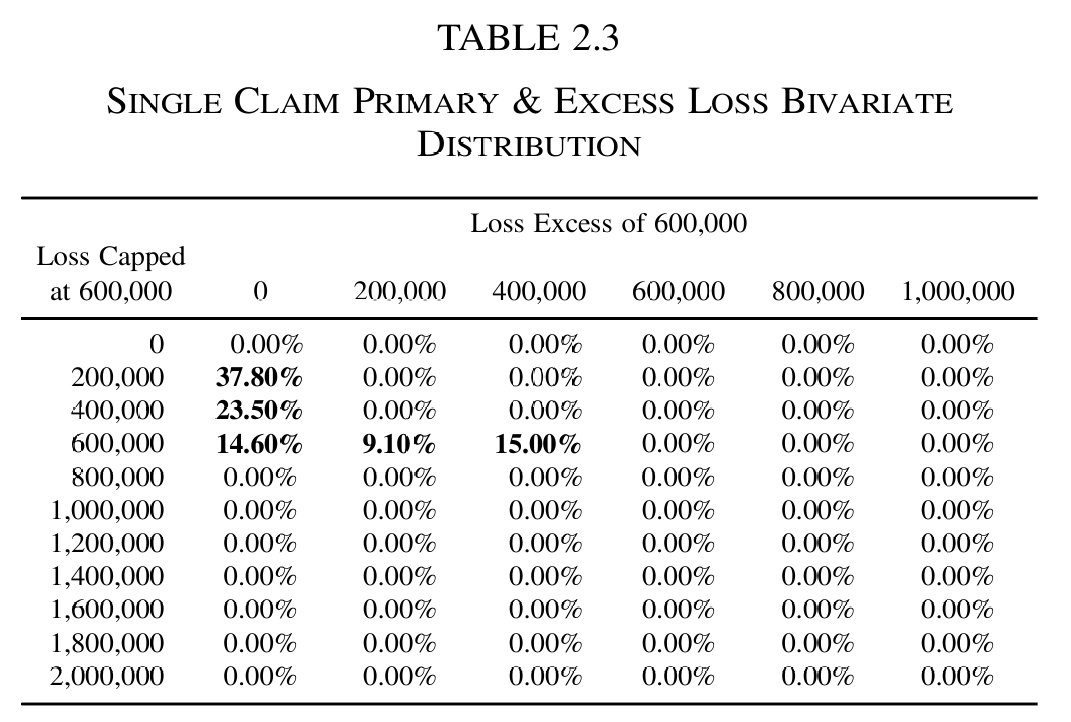
aggregatedoes not need Table 2.3 at all. The retained and ceded amounts are the net and ceded views of one occurrence layer, so the joint per-claim severity is the cession map pushed forward along the gross severity, and the object computes it. The paper spends a page constructing a matrix that is now a consequence of writingoccurrence net of 400000 xs 600000.The contrast with Jin et al. (2016), assessed on its own page, is worth drawing. That paper is dependence through a common shock on the claim counts, which
aggregatecannot express. This one is dependence through a joint severity under a shared count, which is exactly whataggregate’s bivariate is. Jin and coauthors cite Clark and Homer for their FFT benchmark, so the two sit adjacent in the literature; they are on opposite sides of the feature boundary.6.2 What the reproduction cost
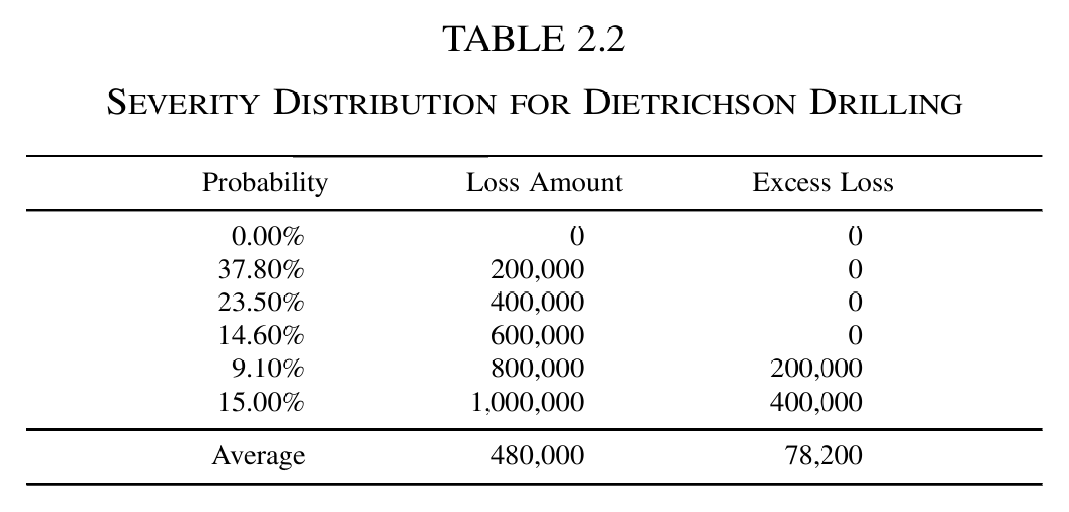
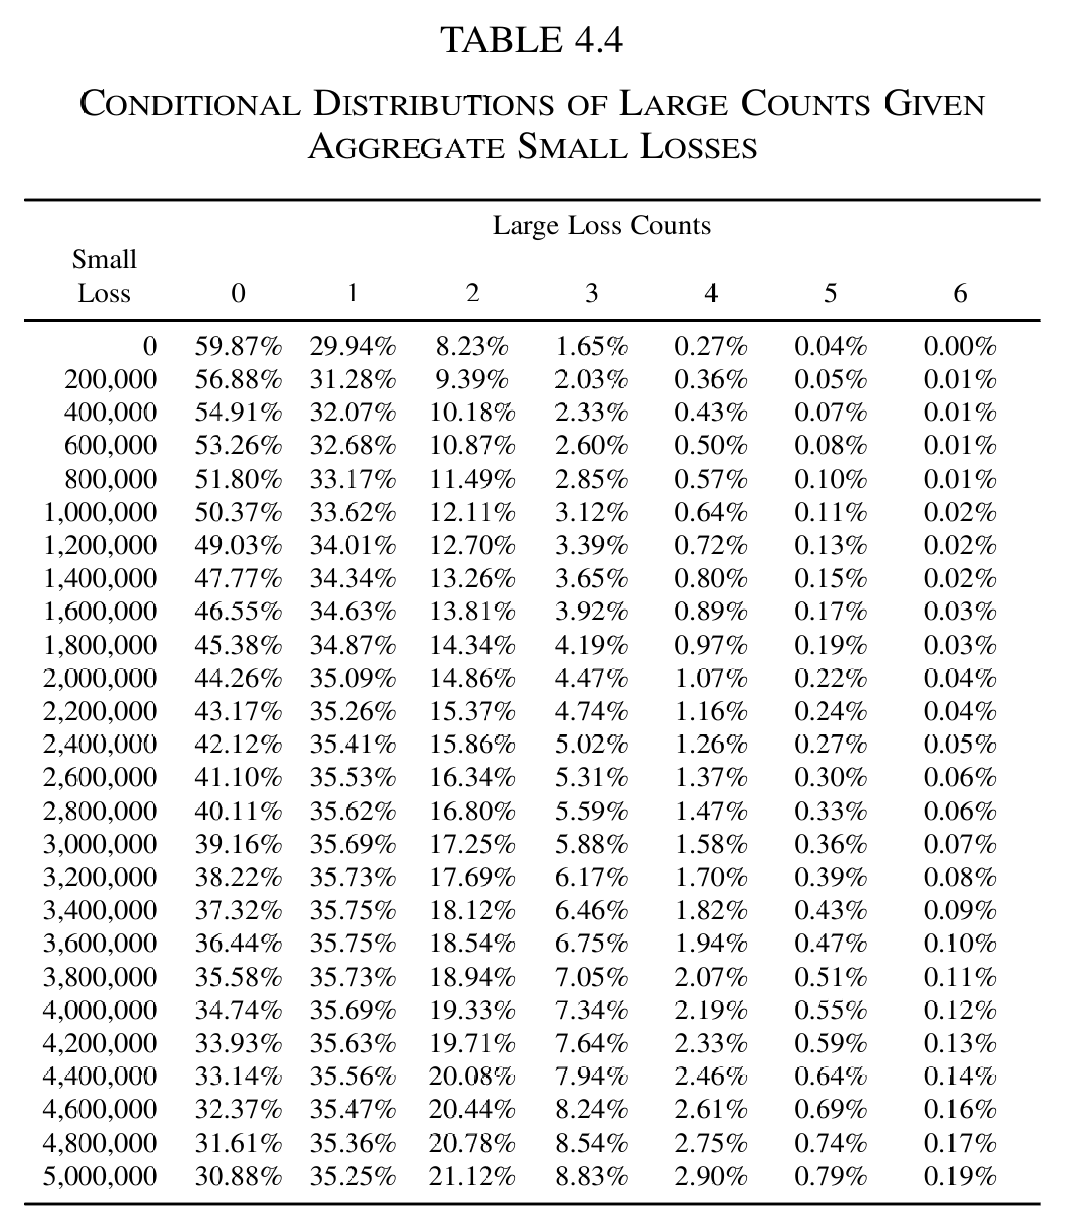
Table 19 scores every published block at once.
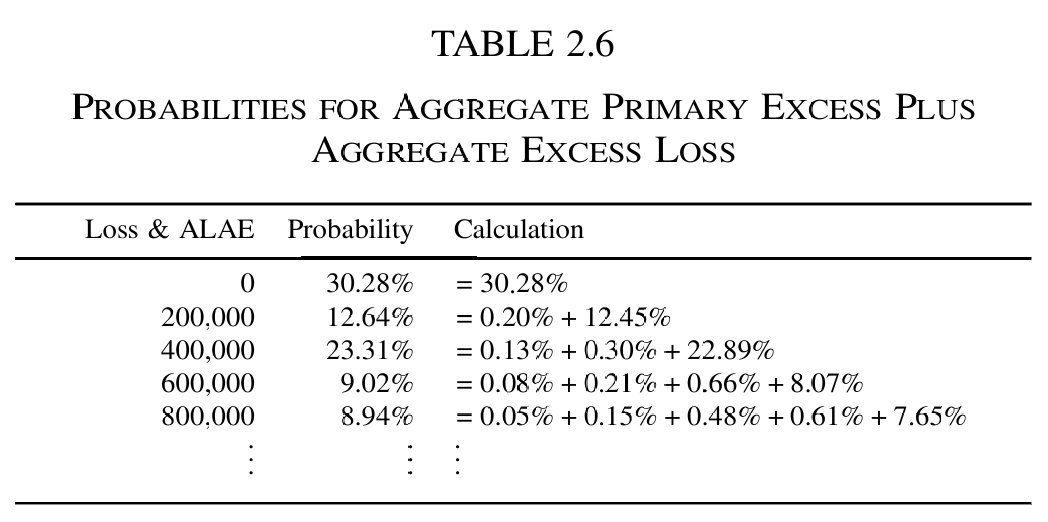
In Table 19, section 2 and section 4 reproduce every published cell at the two decimals printed, and the five section 2 statistics reproduce to the digit. Section 3 reproduces 136 of its 147 cells exactly and misses the other eleven by one unit in the last printed place.
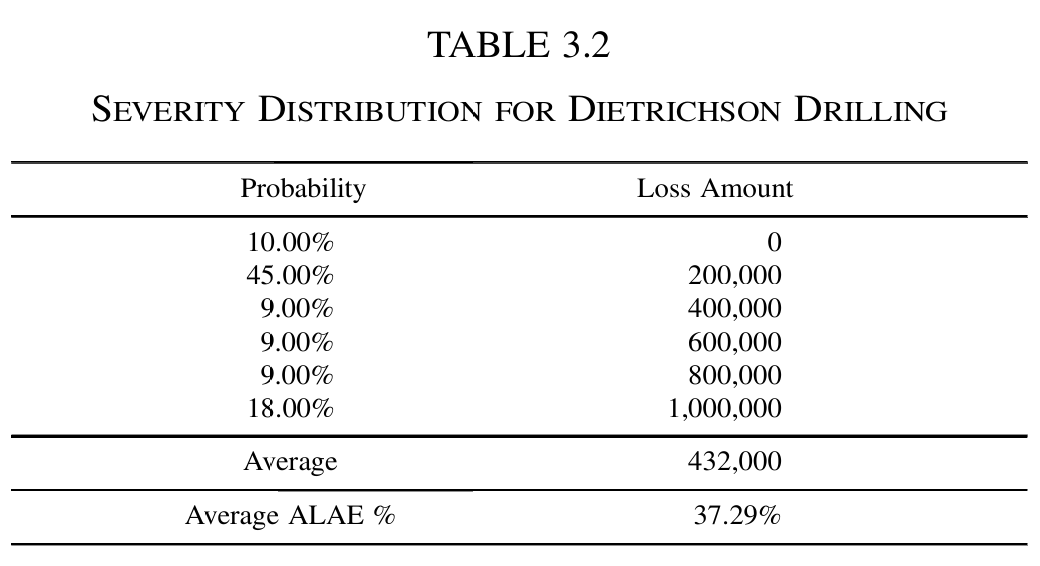
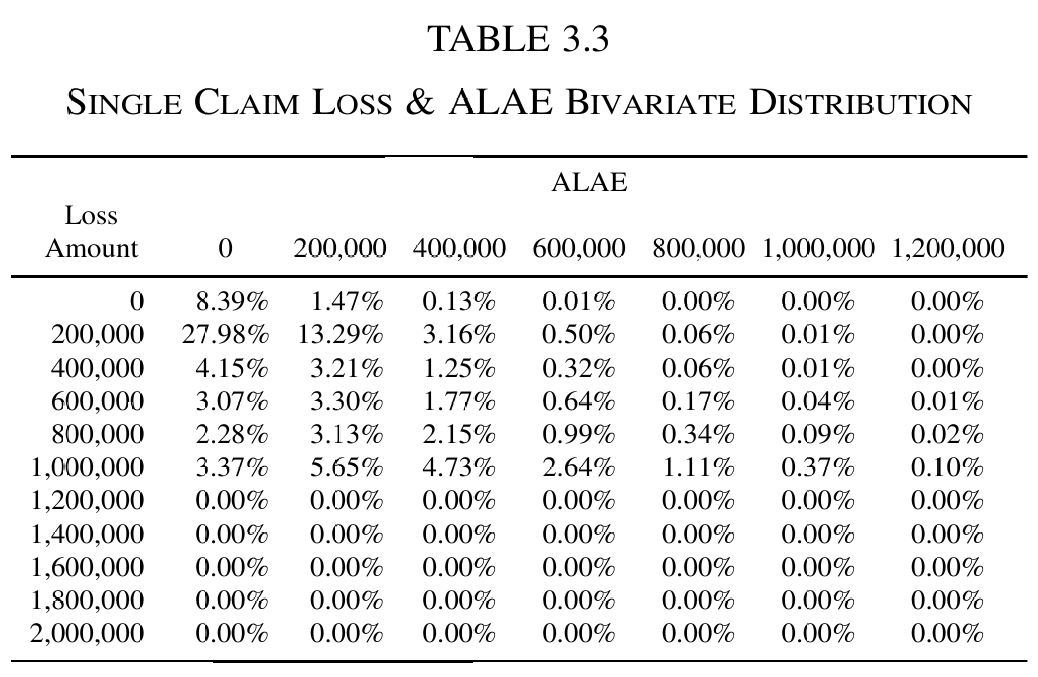
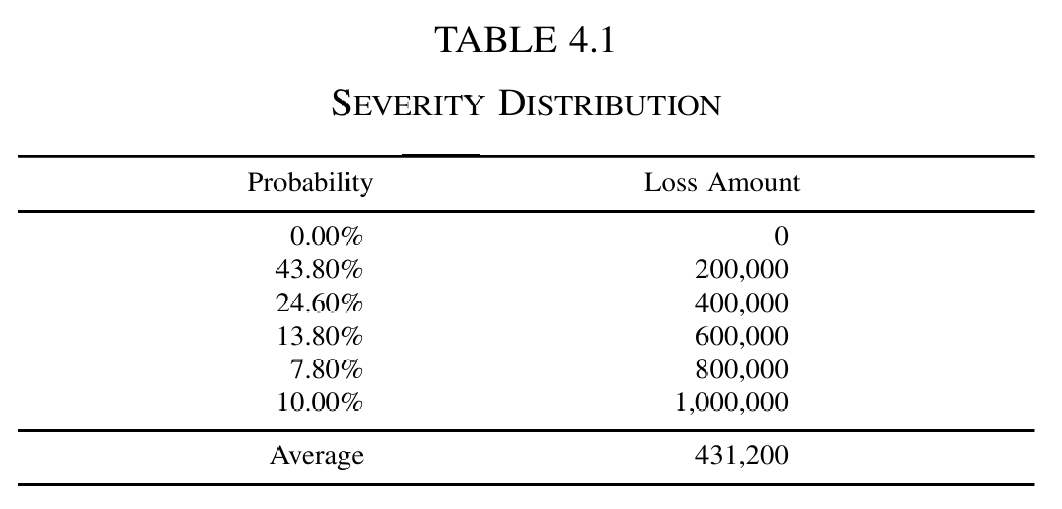
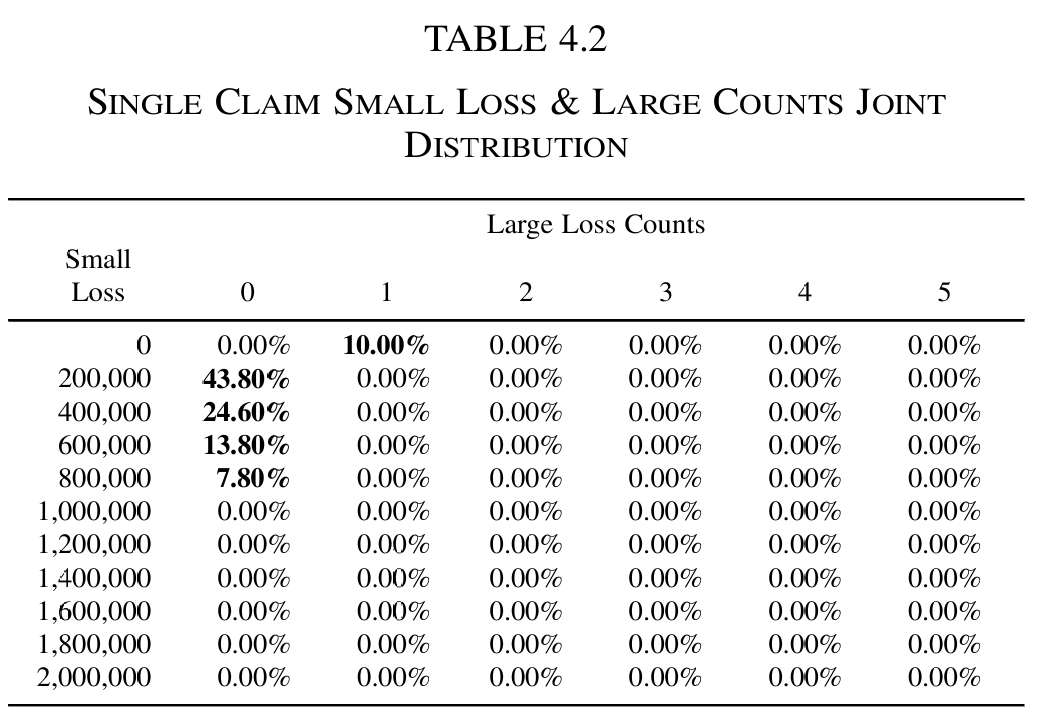
Those eleven are the price of the input matrix. Table 3.3 is itself printed to two decimals, so each of its 42 entries carries up to 0.005% of unstated error, and a four-fold convolution compounds that. Sections 2 and 4 do not have the problem because their inputs are exact: section 2’s severity matrix is derived from a five point severity by the cession map, and section 4’s is a five point severity with a single 10% atom. Where the paper gives an exact input,
aggregatereturns its exact output; where the paper gives a rounded input, the rounding survives.6.3 Grid sizing is the one thing to get right
The first attempt at sections 3 and 4 used a \(2^6\) loss axis and returned garbage: two thirds of the mass missing in section 4 and nine tenths in section 3, and rows that looked like the paper’s but displaced several million dollars up the grid. The cause is that the pinned bucket size and log2 did not cover the measured window, so the window was clipped, and the object says so in Table 20.
A deficit near 1, as in the first row of Table 20, is not a subtle warning, and it is the first thing to read off a bivariate build. Doubling one axis fixed it. This is the two-dimensional version of the padding discussion in the paper’s own Appendix C, where the error bound on the wrapped convolution is \(\|R\| \le \sum_{j>M} \mathsf P(N=j)\): run out of room and the mass does not disappear, it wraps.
6.4 Two blemishes in the paper
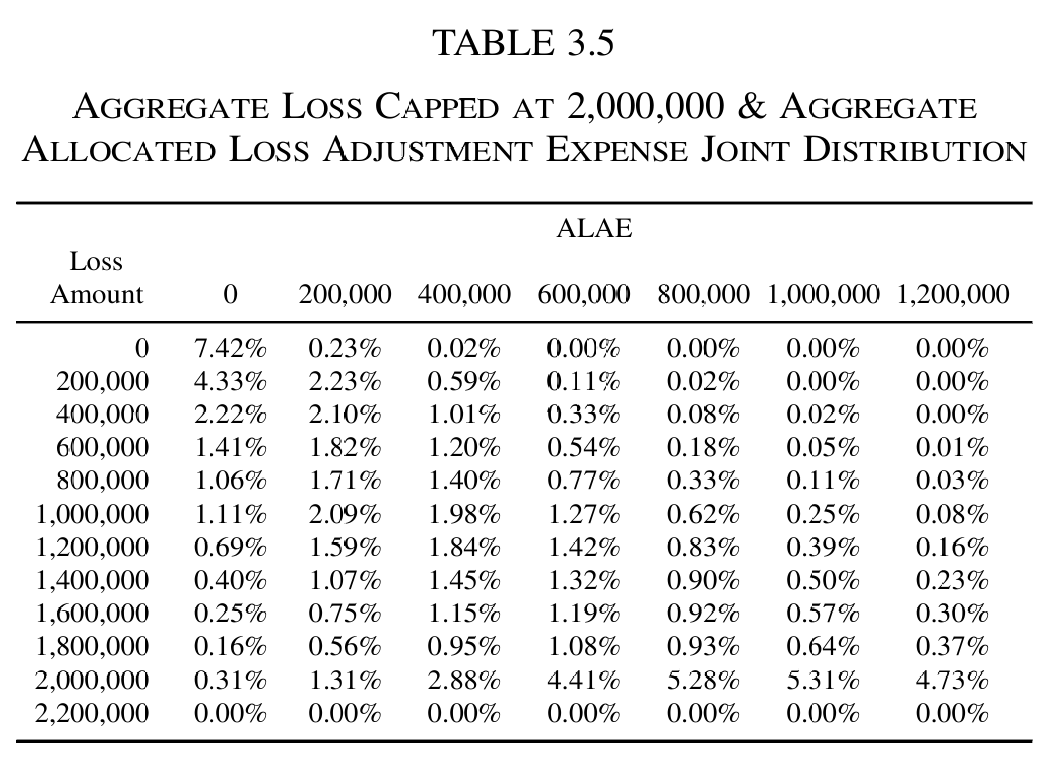
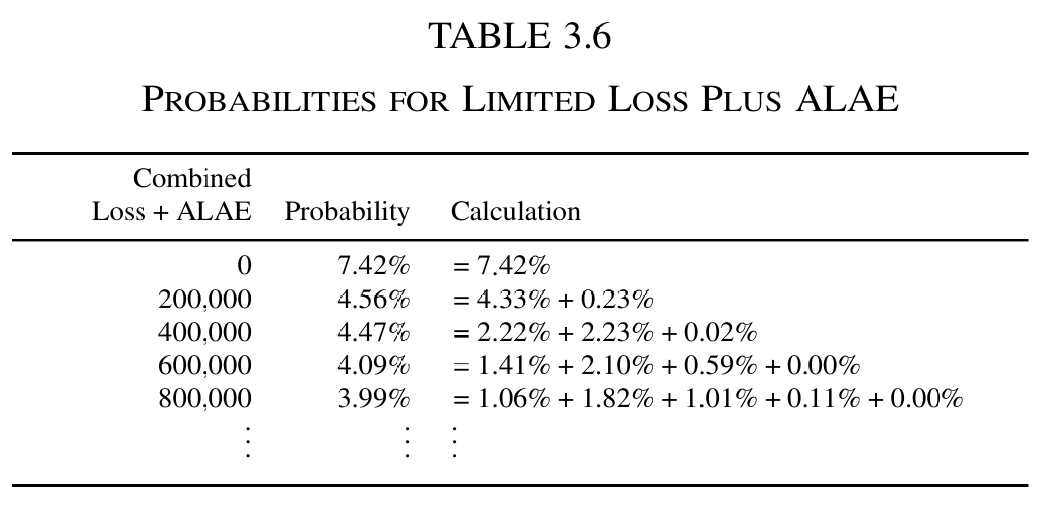
Table 3.3 does not sum to one. Printed to two decimals its rows give 10, 45, 9, 9, 9 and 17.97 percent against the 18 percent that Table 3.2 requires, so the matrix as published carries 99.97% of the mass. Scaling each row onto its Table 3.2 marginal is the correction, and with it Table 3.6 reproduces exactly; normalizing the whole matrix instead leaves Table 3.6 off by 0.01 in three of five cells.
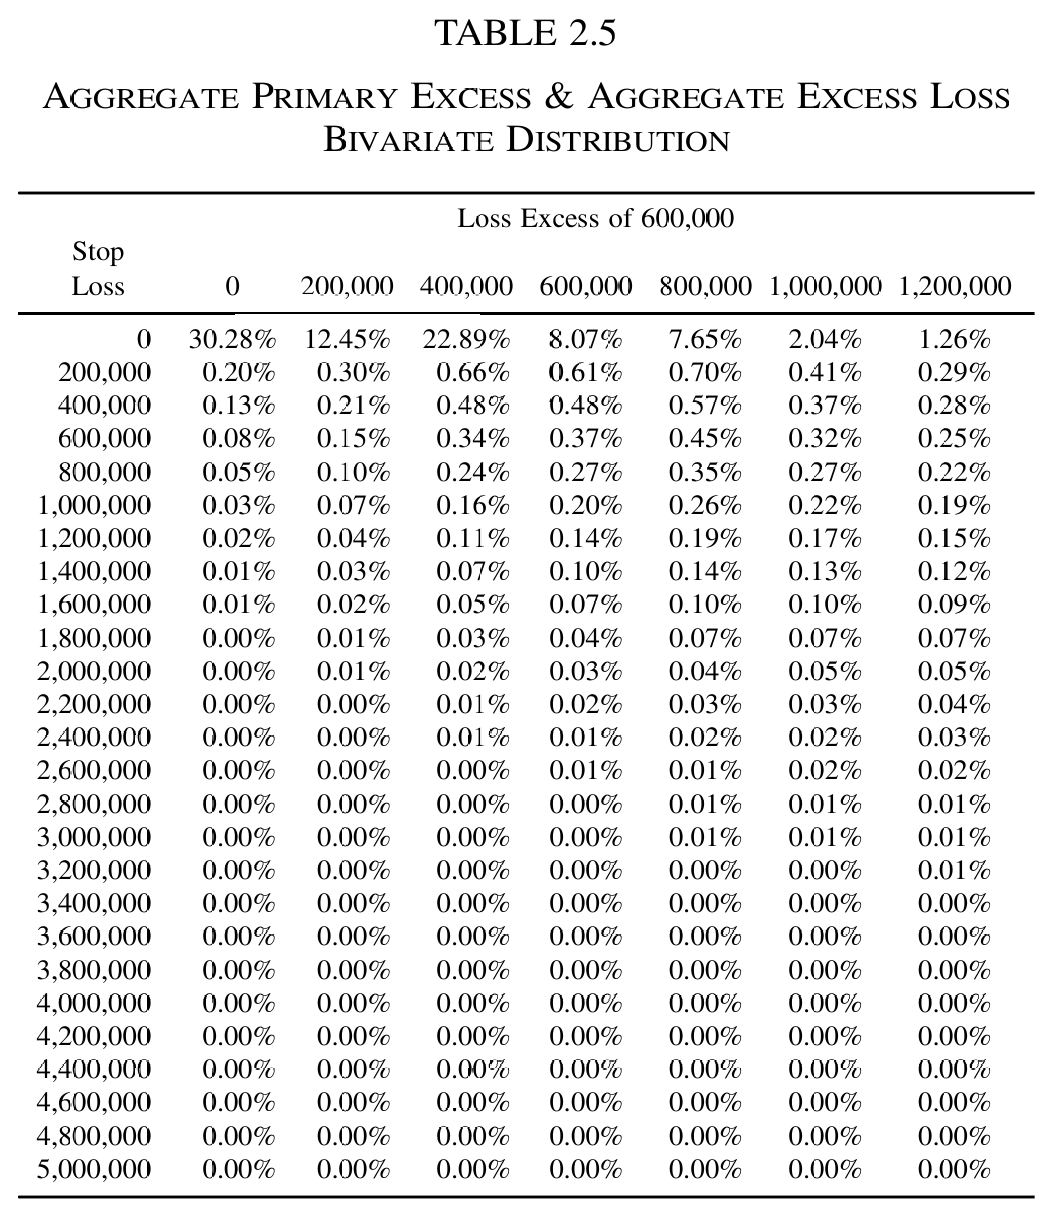
Table 2.6 is captioned “Loss & ALAE Probability Calculation” although it belongs to section 2 and concerns aggregate primary excess plus aggregate excess loss. The heading is a leftover from section 3.