def mean_var(table, t=1, theta=0.0, cap=np.inf):
    """Mean and variance of S_t, in dollars; the variance is lambda t P Y^2."""
    x = table.Dollars.to_numpy()
    w = table.Rate.to_numpy() / table.Rate.sum()
    lam = table.Rate.sum() * t
    if theta == 0:
        y = np.minimum(x, cap)
        return lam * (w @ y), lam * (w @ y ** 2)
    alpha = 1 / theta ** 2
    beta = alpha / x
    m1 = (alpha / beta) * (special.gammainc(alpha + 1, beta * cap) if np.isfinite(cap) else 1)
    m2 = (alpha * (alpha + 1) / beta ** 2) * (special.gammainc(alpha + 2, beta * cap)
                                               if np.isfinite(cap) else 1)
    if np.isfinite(cap):
        tail = special.gammaincc(alpha, beta * cap)
        m1, m2 = m1 + cap * tail, m2 + cap ** 2 * tail
    return lam * (w @ m1), lam * (w @ m2)


def markov(table, s, **model):
    """The Markov bound."""
    return np.minimum(1, mean_var(table, **model)[0] / np.asarray(s, float))


def cantelli(table, s, **model):
    """The Cantelli bound, one above the mean."""
    mu, var = mean_var(table, **model)
    s = np.asarray(s, float)
    return np.where(s >= mu, var / (var + (s - mu) ** 2), 1.0)


def event_mgf(x, v, theta=0.0, cap=np.inf):
    """Each event's MGF at each v: rows are events, columns values of v, in $m.

    Under a cap the gamma MGF is finite for every v. Where v >= beta the
    integral over [0, cap] is a confluent hypergeometric function rather than
    an incomplete gamma function.
    """
    if theta == 0:
        return np.exp(np.outer(np.minimum(x, cap), v))
    alpha = 1 / theta ** 2
    beta = np.broadcast_to((alpha / x)[:, None], (len(x), len(v)))
    c = beta - v[None, :]
    pos = c > 0
    body = np.full(c.shape, np.inf)
    if np.isinf(cap):
        body[pos] = (beta[pos] / c[pos]) ** alpha
        return body
    body[pos] = special.gammainc(alpha, c[pos] * cap) * (beta[pos] / c[pos]) ** alpha
    body[~pos] = ((beta[~pos] * cap) ** alpha / special.gamma(alpha + 1)
                  * special.hyp1f1(alpha, alpha + 1, -c[~pos] * cap))
    return body + special.gammaincc(alpha, beta * cap) * np.exp(v[None, :] * cap)


def paper_v(table, theta=0.0, cap=np.inf, nk=1001):
    """The authors' Chernoff search: nk equally spaced v, per $m, from the Appendix."""
    x = table.Dollars.to_numpy() / M
    if theta == 0:
        return np.linspace(0, np.min(100 / np.minimum(x, cap / M)), nk)
    alpha = 1 / theta ** 2
    return np.linspace(0, min(np.min(100 / x), np.min(alpha / x)), nk + 1)[:-1]


def chernoff(table, s, v, t=1, theta=0.0, cap=np.inf, interior=False):
    """The Chernoff bound minimized over the grid v, set to 1 below the mean."""
    x = table.Dollars.to_numpy() / M
    rate = table.Rate.to_numpy()
    log_mgf = t * (rate @ event_mgf(x, v, theta, cap / M) - rate.sum())
    s_m = np.asarray(s, float) / M
    objective = log_mgf[None, :] - np.outer(s_m, v)
    if interior:                     # an unrestricted search must not hit its edge
        assert (objective.argmin(axis=1) < len(v) - 1).all()
    mu = mean_var(table, t, theta, cap)[0] / M
    return np.where(s_m > mu, np.minimum(1, np.exp(objective.min(axis=1))), 1.0)


def bounds(table, s, t=1, theta=0.0, cap=np.inf):
    """Every bound for one case, keyed by the paper's legend.

    With fixed losses the optimal v must lie inside the authors' range, which
    the interior check enforces; with gamma losses it may sit at the edge.
    """
    model = dict(t=t, theta=theta, cap=cap)
    out = {'Moment': moment_bound(table, s, **model),
           'Chernoff': chernoff(table, s, paper_v(table, theta, cap),
                                interior=theta == 0, **model),
           'Cantelli': cantelli(table, s, **model)}
    if theta == 0:
        out['Markov'] = markov(table, s, **model)
    return out


STYLE = {'exact': dict(c='k', lw=1.4), 'Moment': dict(c='C0', lw=1),
         'Chernoff': dict(c='C1', lw=1),
         'Chernoff, unrestricted': dict(c='C1', lw=1, ls='--'),
         'Cantelli': dict(c='C2', lw=1), 'Markov': dict(c='C3', lw=1, ls=':')}


def case_figure(s, curves, t=1, floor=1e-5):
    """The paper's linear panel beside a log panel, every curve in both."""
    fig, axs = figure('full', 1, 2, layout='constrained')
    for name, y in curves.items():
        axs[0].plot(s / M, y, label=name, **STYLE[name])
        axs[1].semilogy(s / M, y, **STYLE[name])
    ylabel = rf'$\mathsf{{P}}(S_{{{t}}} \geq s)$'
    axs[0].set(xlabel='s, $m', ylabel=ylabel, ylim=(0, 1.02), title='as the paper draws it')
    axs[1].set(xlabel='s, $m', ylabel=ylabel, ylim=(floor, 1.5), title='log scale')
    axs[0].legend(fontsize=6)
    return fig


T4 = TABLES[-4]
CASES = {'Figure 3': dict(t=1, theta=0.0, cap=np.inf, s=np.linspace(5, 40, 101) * M,
                          points=np.array([10, 20, 30, 40]) * M),
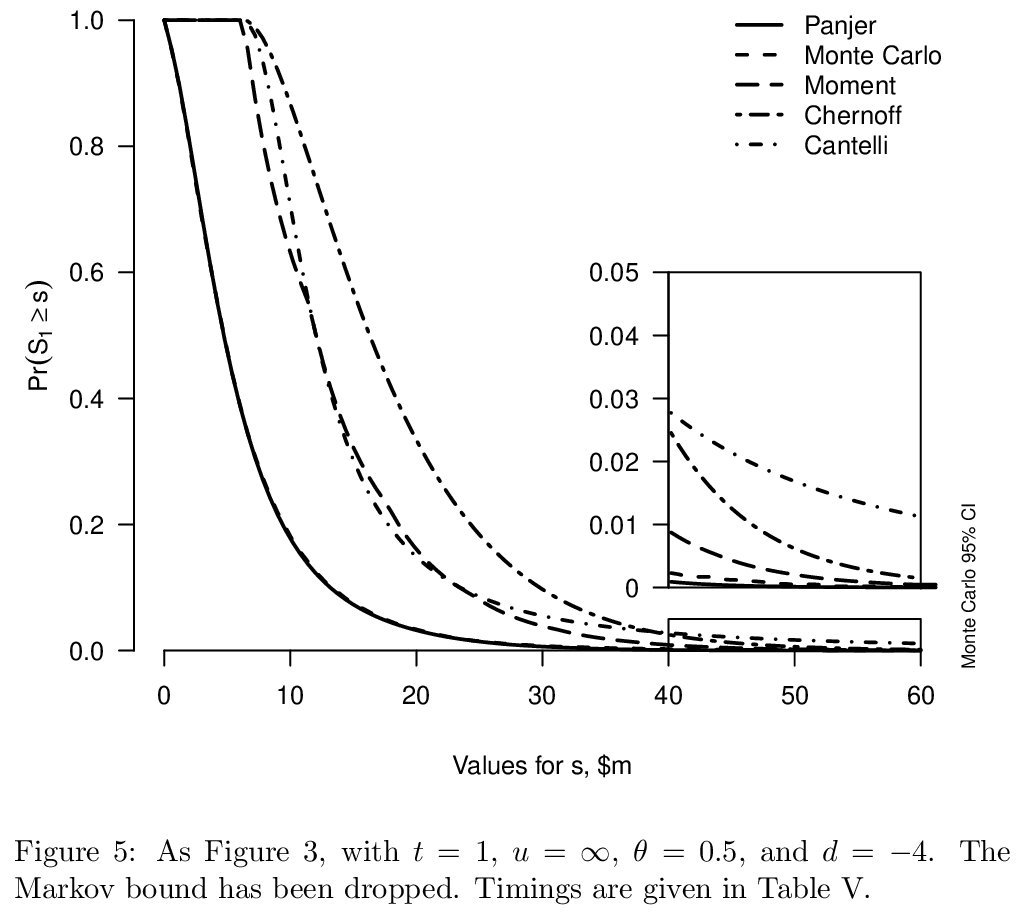
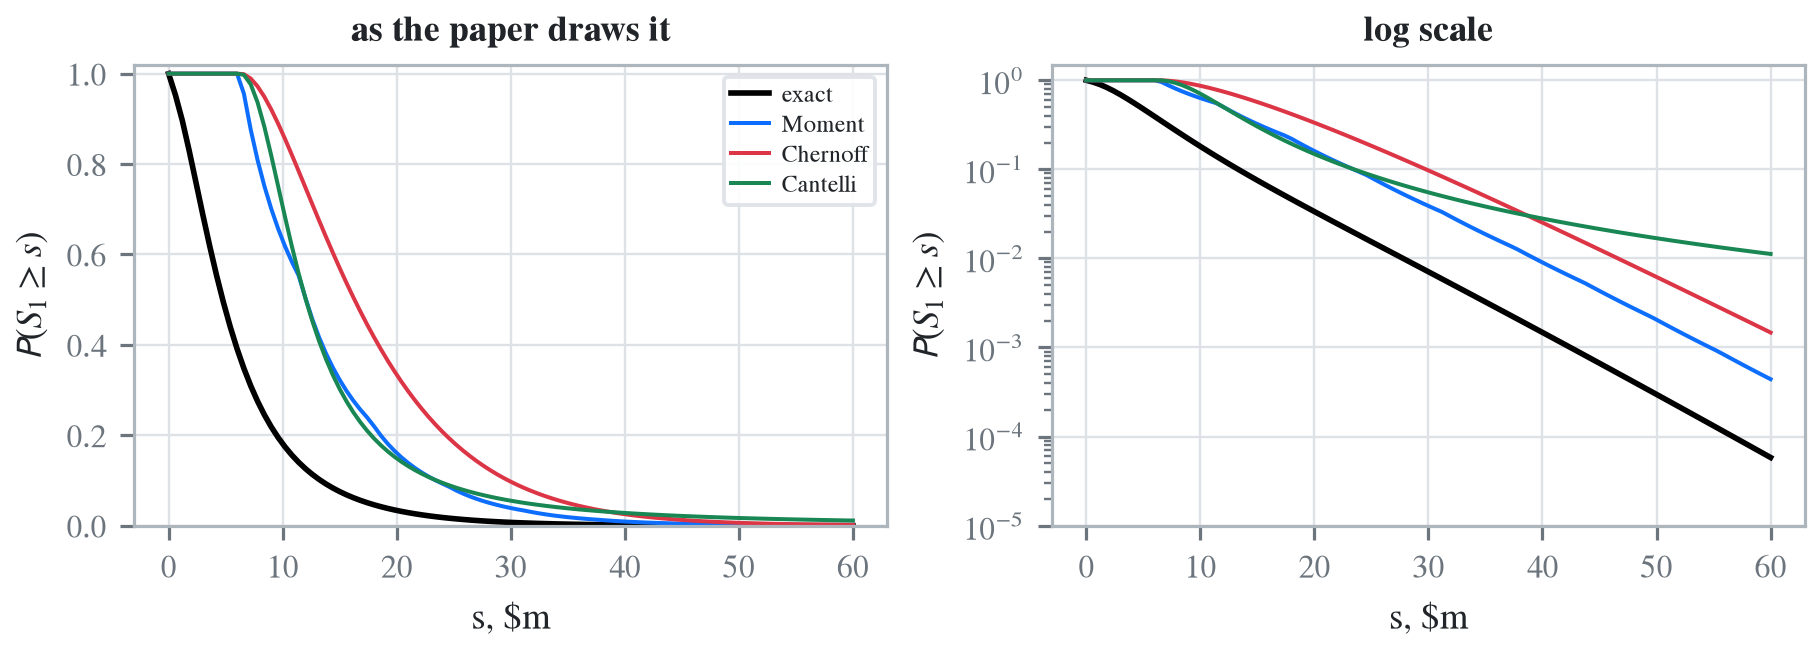
         'Figure 5': dict(t=1, theta=0.5, cap=np.inf, s=np.linspace(0, 60, 101) * M,
                          points=np.array([20, 40, 60]) * M),
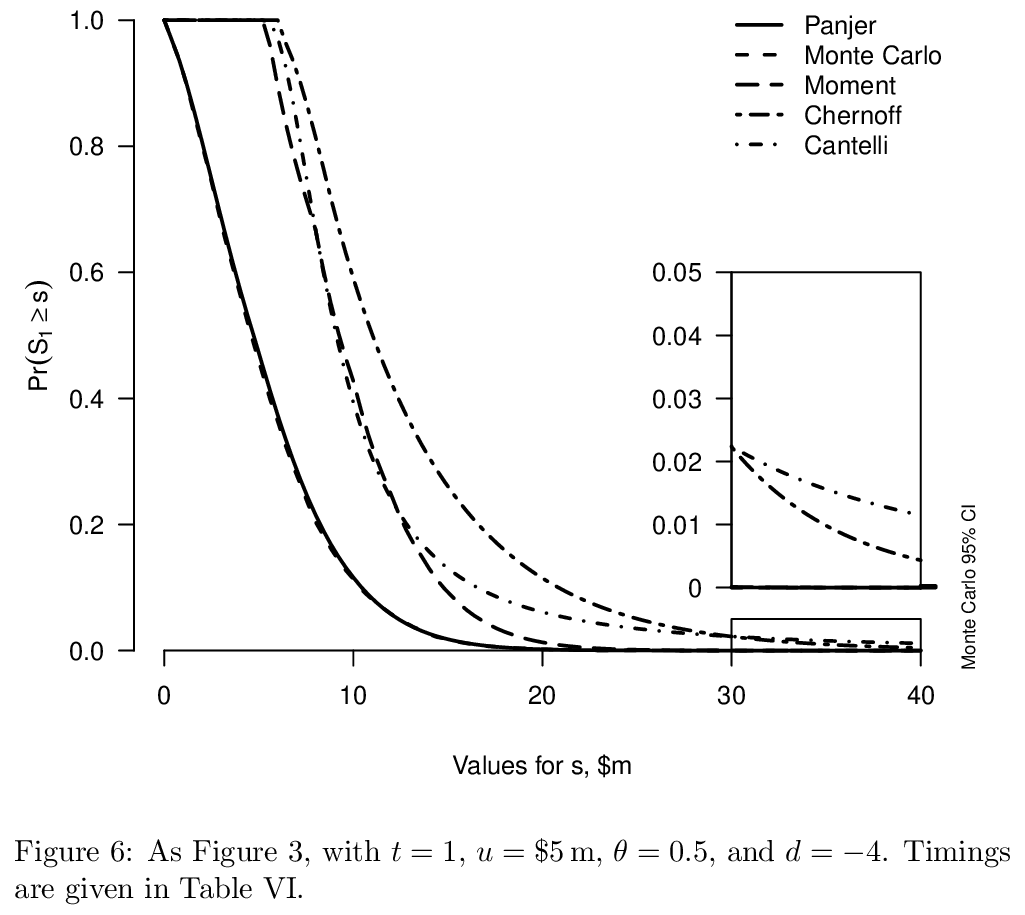
         'Figure 6': dict(t=1, theta=0.5, cap=5 * M, s=np.linspace(0, 40, 101) * M,
                          points=S3),
         'Figure 7': dict(t=10, theta=0.5, cap=5 * M, s=np.linspace(0, 120, 101) * M,
                          points=np.array([60, 90, 120]) * M)}
EXACT_CASE = {'Figure 3': H}
case = CASES['Figure 3']
case_figure(case['s'], {'exact': exceed(H, case['s']),
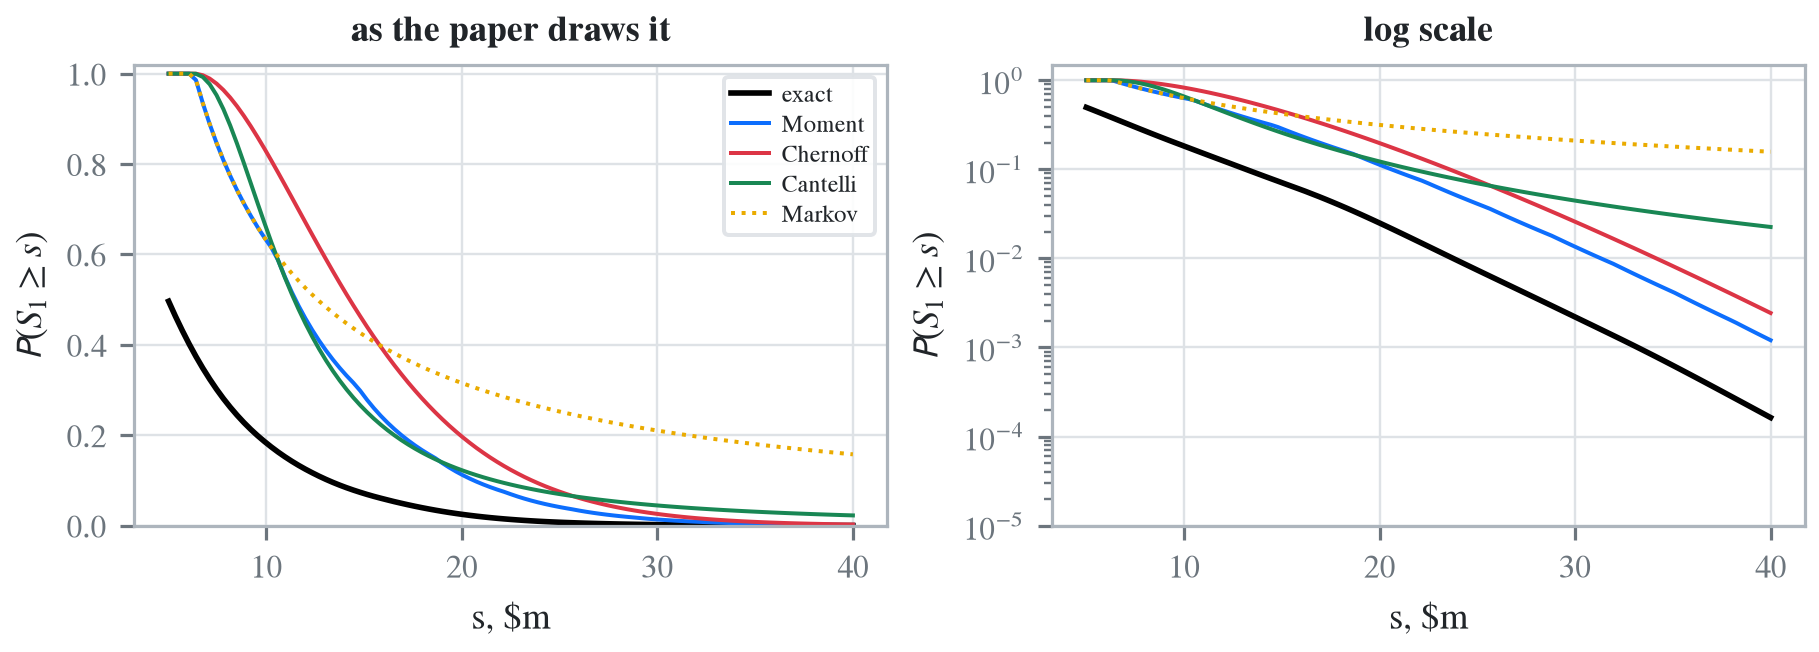
                        **bounds(T4, case['s'], case['t'], case['theta'], case['cap'])});
4 Comments
4.1 Reach of the exact computation
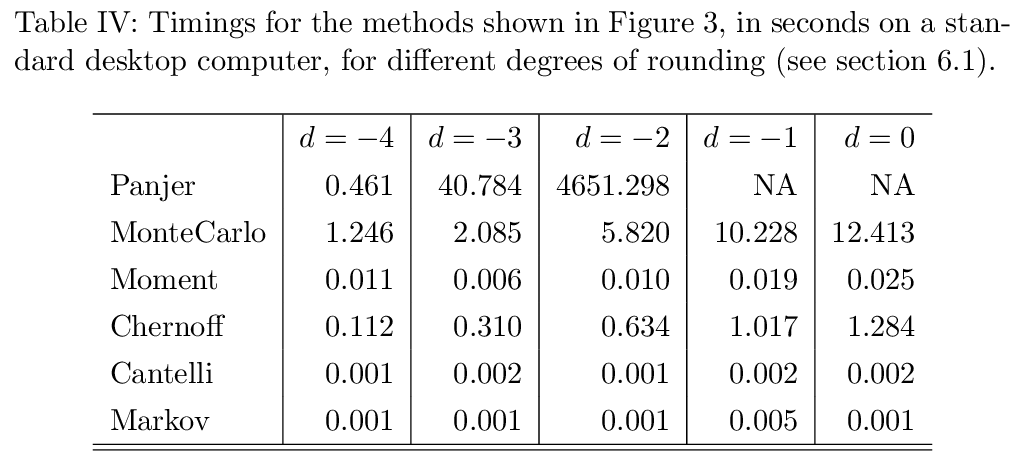
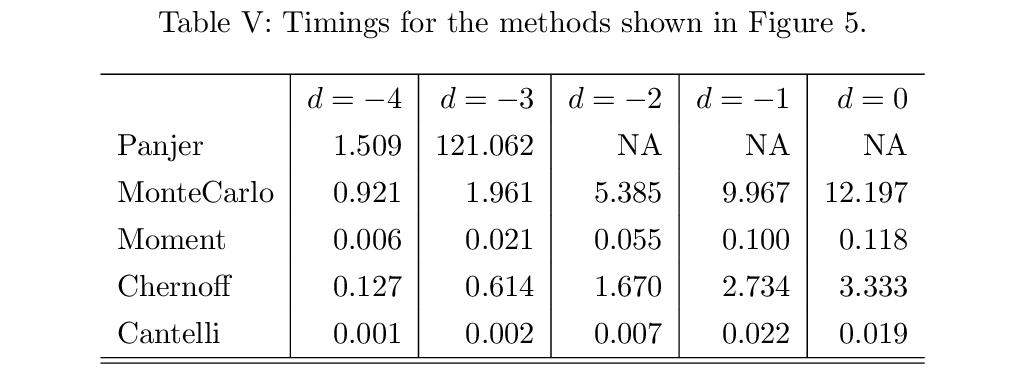
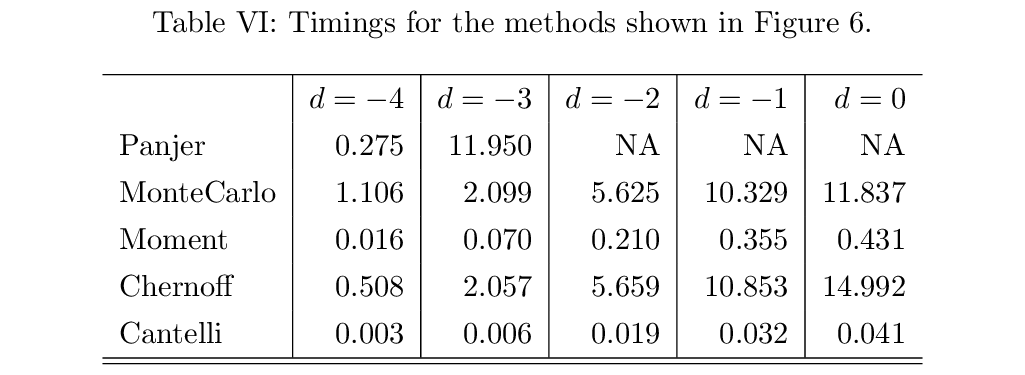
The authors’ case for bounds rests on exact methods being too slow without compression. On the evidence of Table 6 and Table 13 that premise no longer holds, and it did not hold in 2015 either: the FFT was as available then as now, and the reason it is fast is the structure of the compound Poisson, not the speed of the machine. The uncompressed table takes a fraction of a second at a $100 bucket, and the gamma version takes about a second. The bounds keep a use where only the moments of a table are known, or where a bound is needed in closed form inside some larger calculation, but as a substitute for computing the distribution of a table that is in hand they are not needed.
4.2 Looseness of the bounds
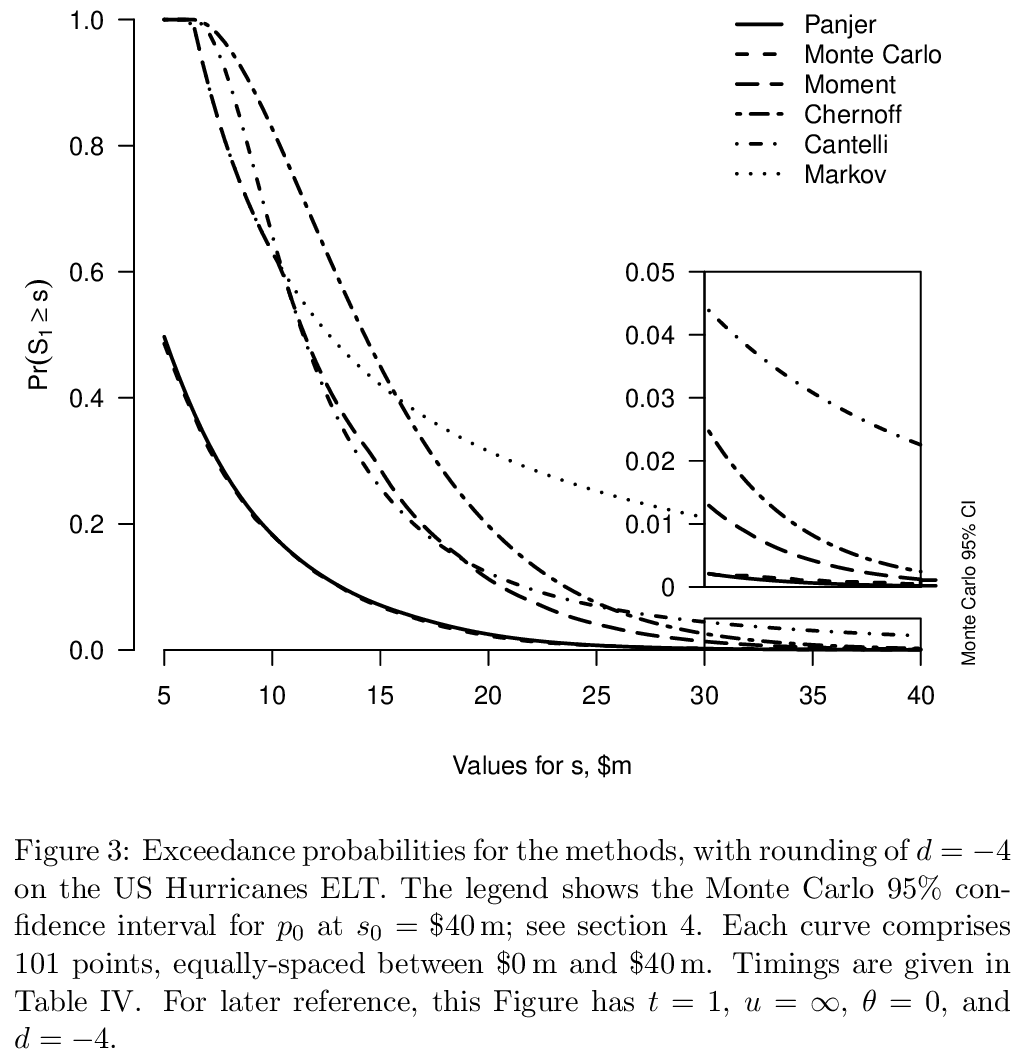
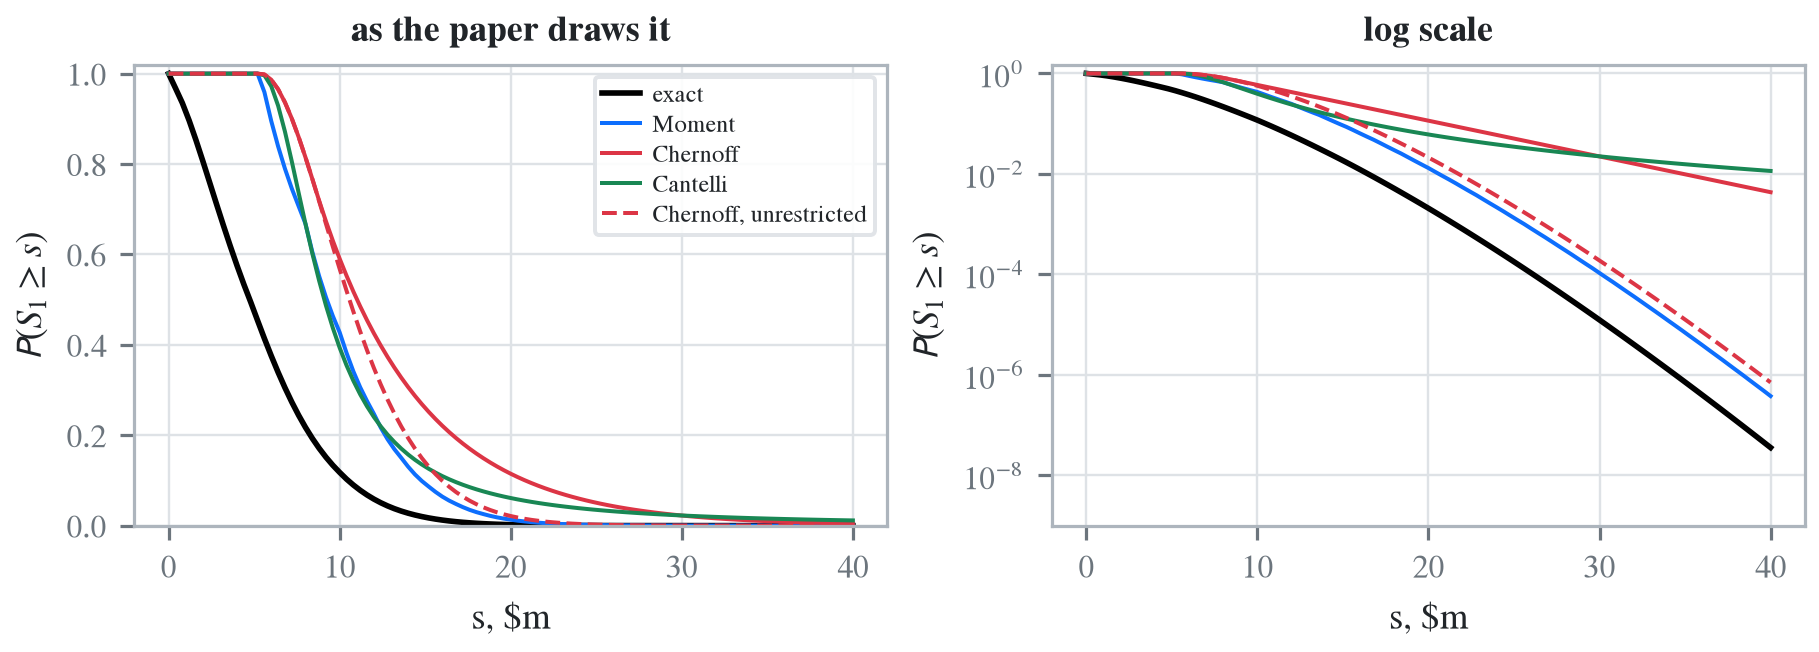
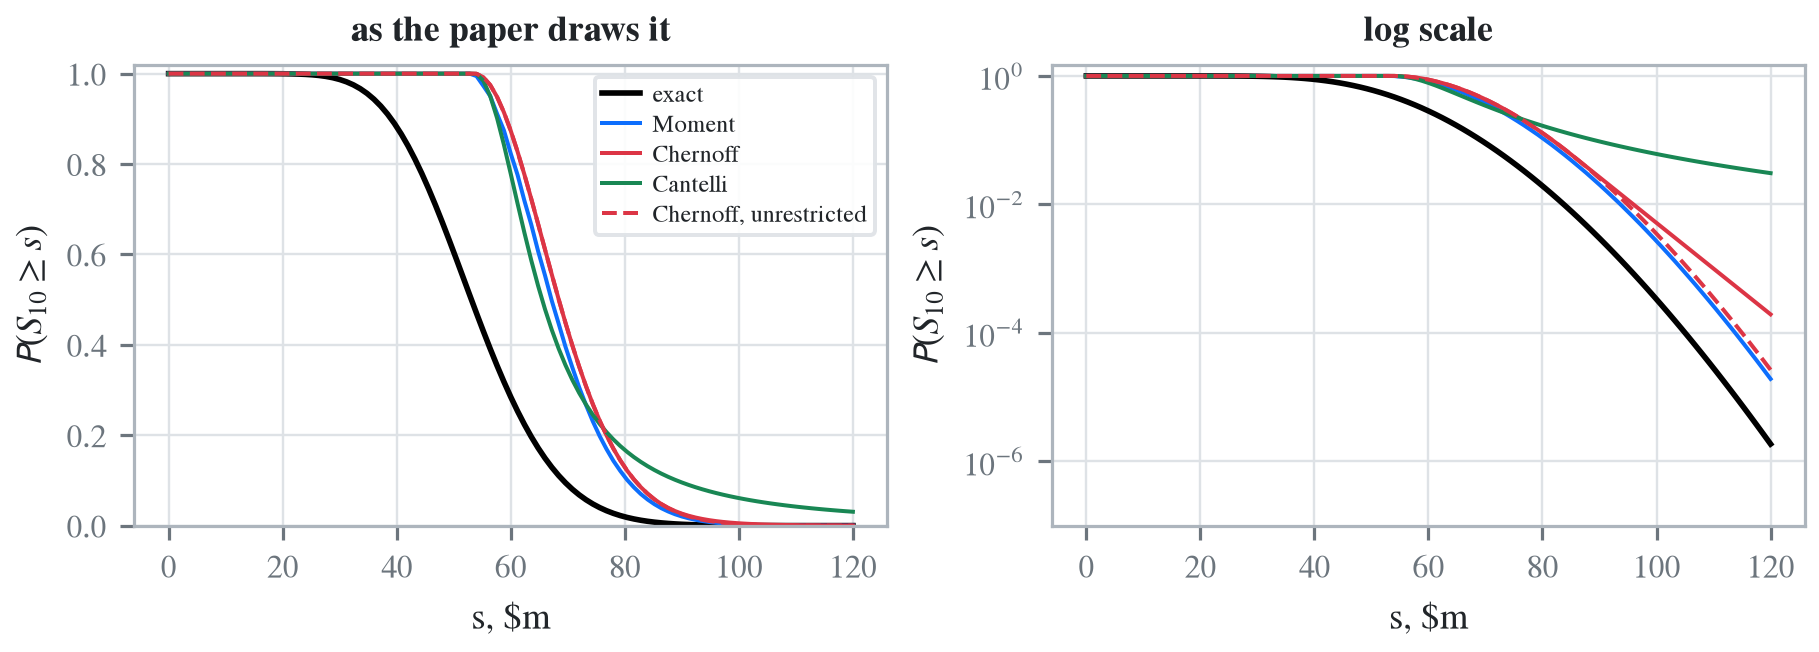
The exact 1-in-200 annual loss with fixed event losses is $26.6m. Table 14 gives, for each bound, the smallest capital \(s\) at which the bound falls to 0.005, which is the solvency question asked of the bound directly. On the full table the moment bound calls for 29% more capital than the exact answer, Chernoff for 39% more, and Cantelli for nearly three times as much. A regulator satisfied by a bound is satisfied at a cost, and the exact answer costs a second.
4.3 Large deviations and the Chernoff bound
In Section 3 the authors argue from large deviations that “as \(t\) becomes large the Chernoff upper bound becomes exact”, and that, the moment bound being tighter, “both bounds are converging from above on the actual probability”. In Section 6.1 they rely on the argument to judge compression with the moment bound. The large deviations limit is a statement about the exponent: for a fixed loss per year \(a\) above the mean, \(t^{-1}\log \mathsf P(S_t \ge at) \to -I(a)\), and the Chernoff bound is \(e^{-tI(a)}\) exactly. The \(o(t)\) term in the authors’ display allows any factor that grows more slowly than an exponential. By the theorem of Bahadur and Rao (1960) the factor is \[ \frac{e^{-tI(a)}}{\mathsf P(S_t \ge at)} \sim v_a \sigma_a \sqrt{2\pi t}, \] where \(v_a\) is the optimal \(v\) and \(\sigma_a^2 = \lambda \mathsf P(Y^2 e^{v_a Y})\) is the annual variance under the tilted measure. The ratio of the bound to the probability grows like \(\sqrt t\); the bound is exact on a logarithmic scale and not otherwise. Table 15 shows the ratio at $15m a year on the full table with fixed losses, and the ratio follows the prediction ever more closely as \(t\) grows. The moment bound’s ratio grows too.
Holding the probability fixed instead of the loss per year gives the same answer by another route. At the 99.5% point of \(S_t\) the central limit theorem takes over as \(t\) grows, the Chernoff bound tends to \(e^{-z^2/2}\) with \(z\) the normal 99.5% point, and the ratio to 0.005 tends to 7.25, not to 1. Table 16 shows the ratio at one year and at ten on its way there.
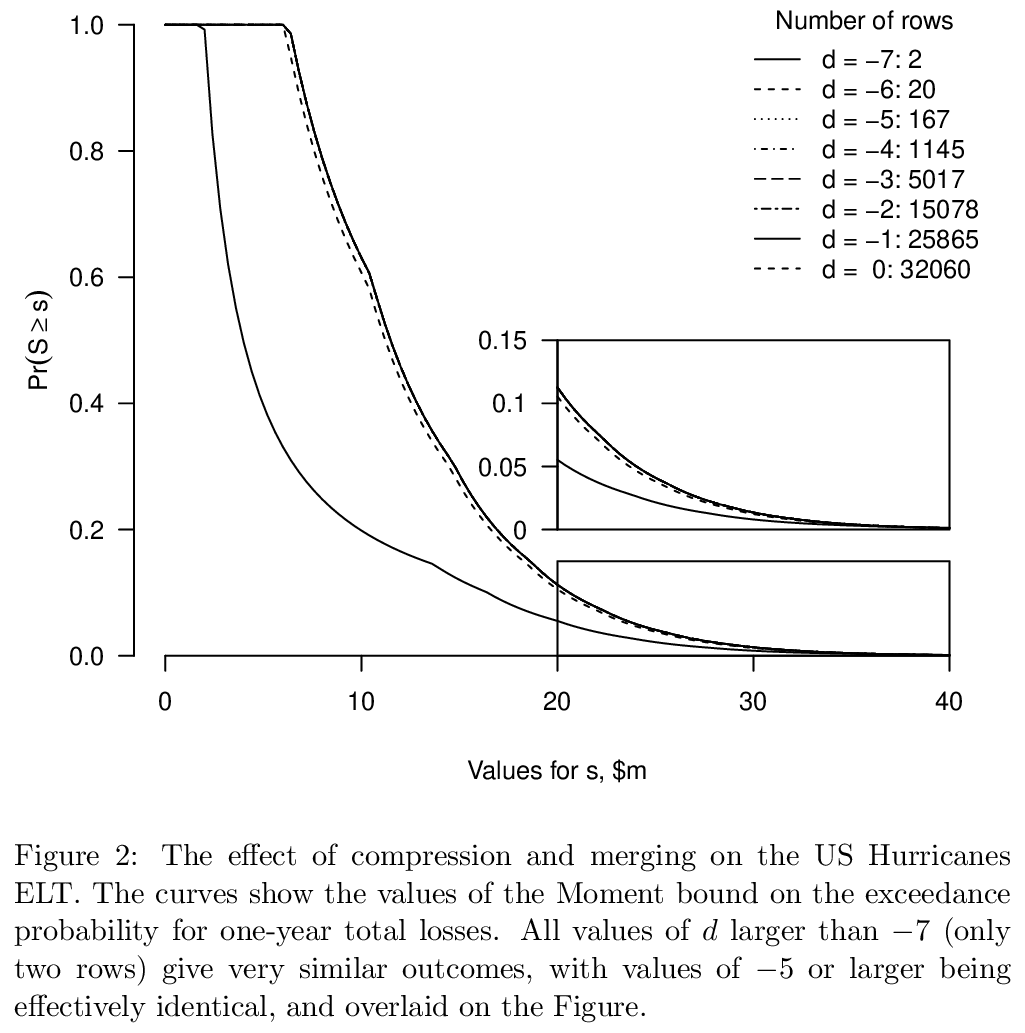
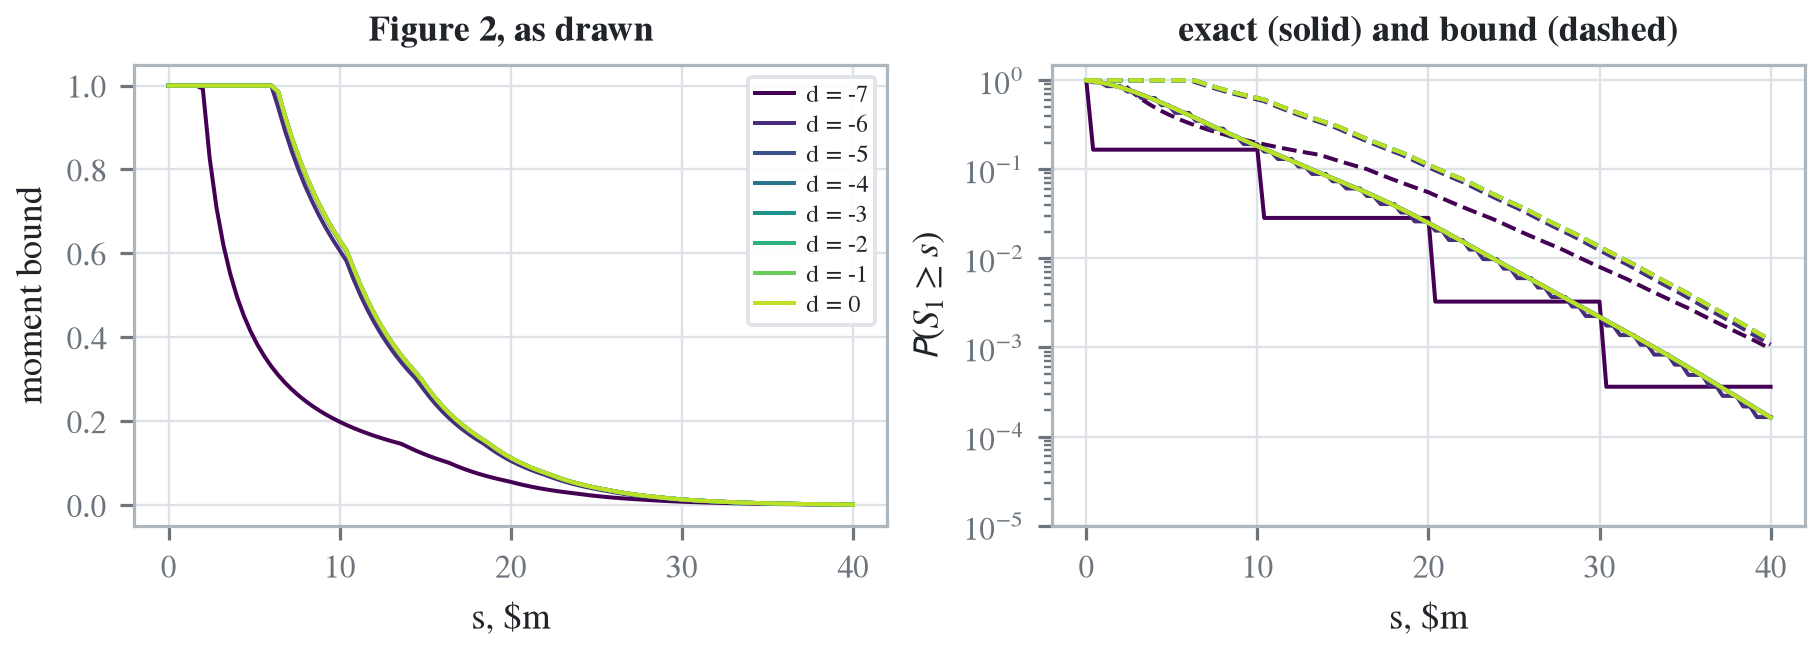
Neither limit is 1. The squeeze the authors describe does not occur, and a bound that is several times the probability at every horizon cannot serve as the yardstick for a compression error of a few percent, which is what Table 8 found.
4.4 The Monte Carlo sample size
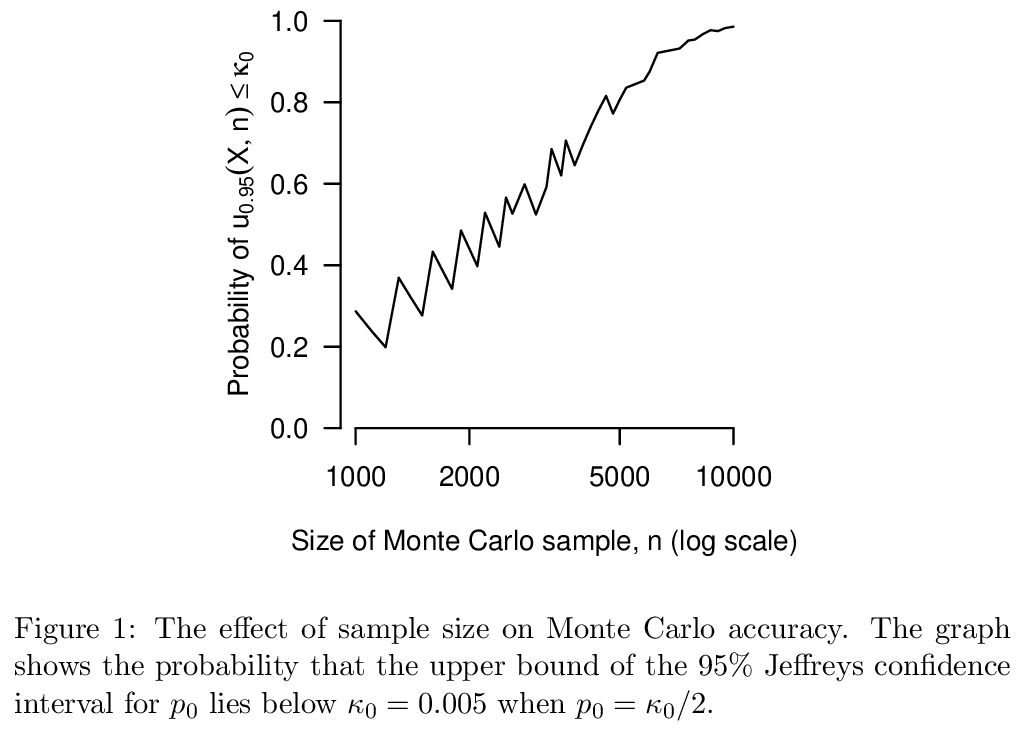
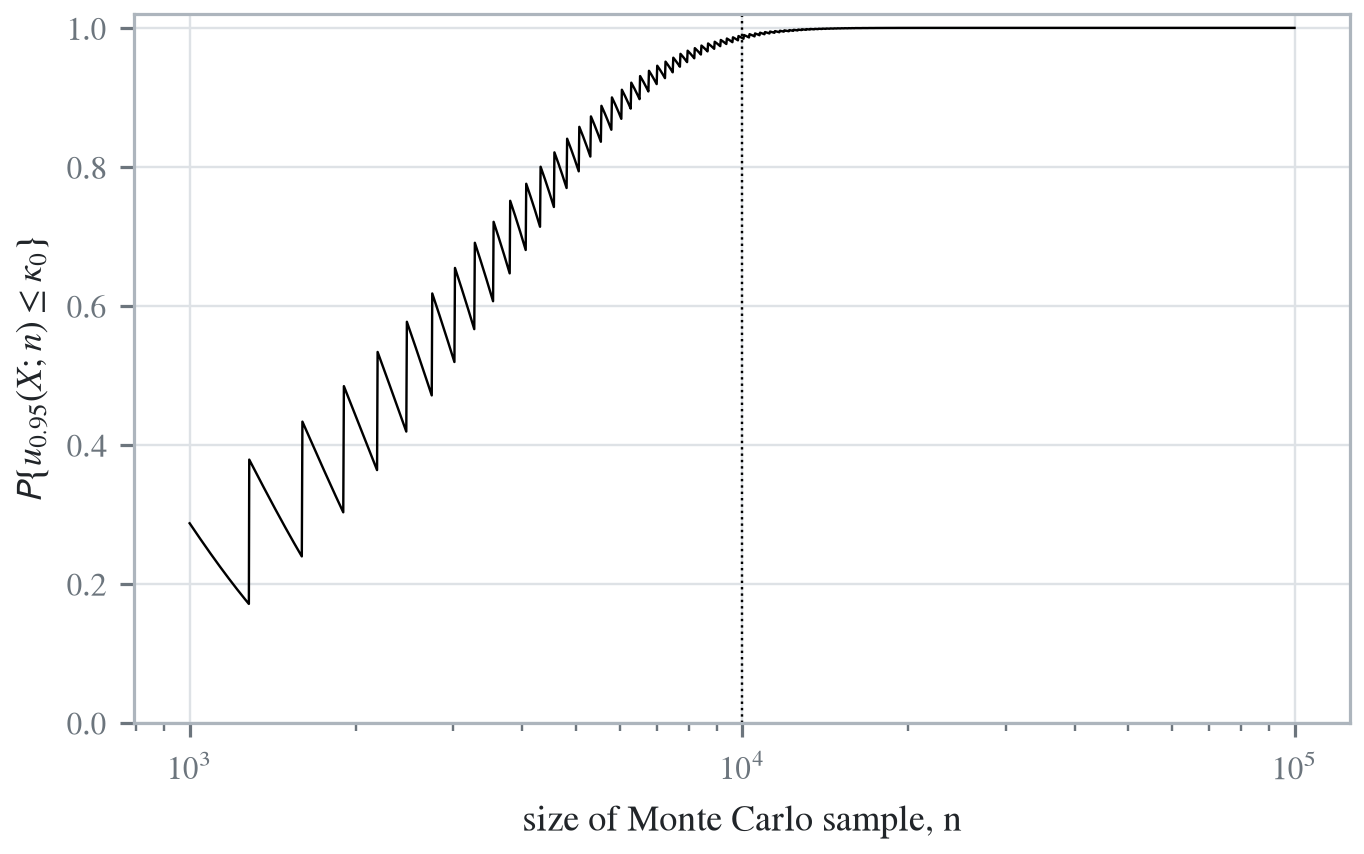
The authors give two sample sizes. In Section 4 and Section 6.2 they give \(10^5\). Figure 1 supports \(10^4\), the summary in Section 7 recommends 10,000, and the package default, from which the figures were drawn, is \(10^4\). On the authors’ own design calculation, Figure 13, \(10^4\) is the defensible choice, with a probability of 0.986, and \(10^5\) is ample. The inconsistency is in what the text reports: a sample ten times the one the figures were computed from.
4.5 The Monte Carlo time in Table VII
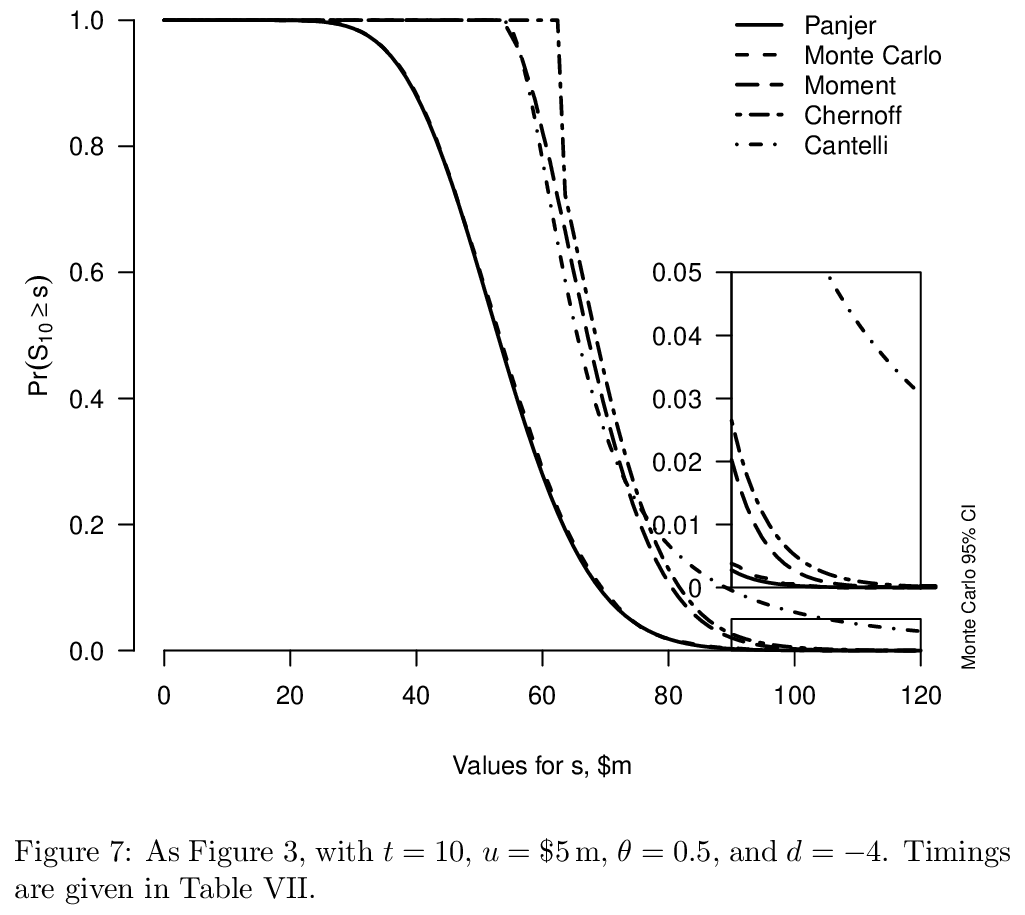
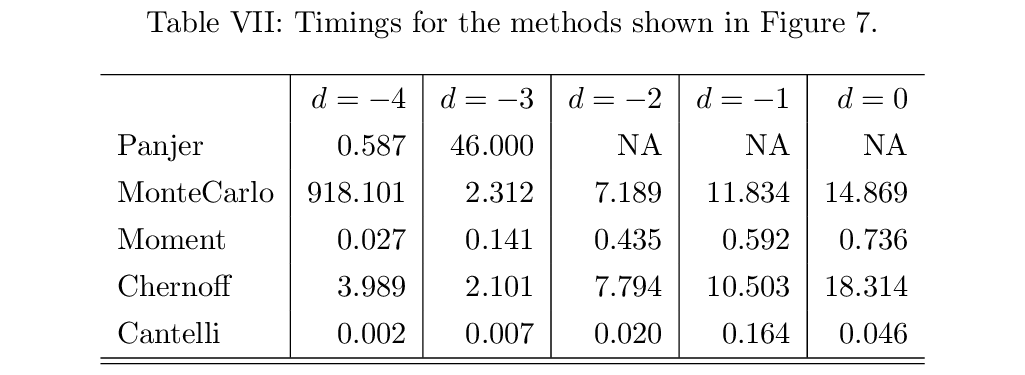
In Figure 17 Monte Carlo takes 918.101 seconds at \(d = -4\) and 2.312 seconds at \(d = -3\). Every other Monte Carlo time in the four tables is between 0.9 and 15 seconds and grows with the size of the table, as it should, since a simulation draws from the table. The value at \(d = -4\) is out of line by a factor of several hundred and is most likely an interruption during the run rather than a property of the method. A timing cannot be reproduced, so the point stays an observation.
4.6 The capped gamma and the DecL limit
The authors prefer a capped gamma to a beta scaled to \([0, u]\) because the cap leaves an atom at \(u\), which is what a maximum insured loss does, while a scaled beta has none. A DecL limit,
5 xs 0in theHurricane.Cappedprogram, places exactly that atom on the severity, andaggregateapplies it to any severity, the gamma mixture included. The cap also bounds the loss, which is what makes the MGF finite everywhere and the authors’ Chernoff range too narrow, as Table 10 showed.4.7 Long vectors in DecL
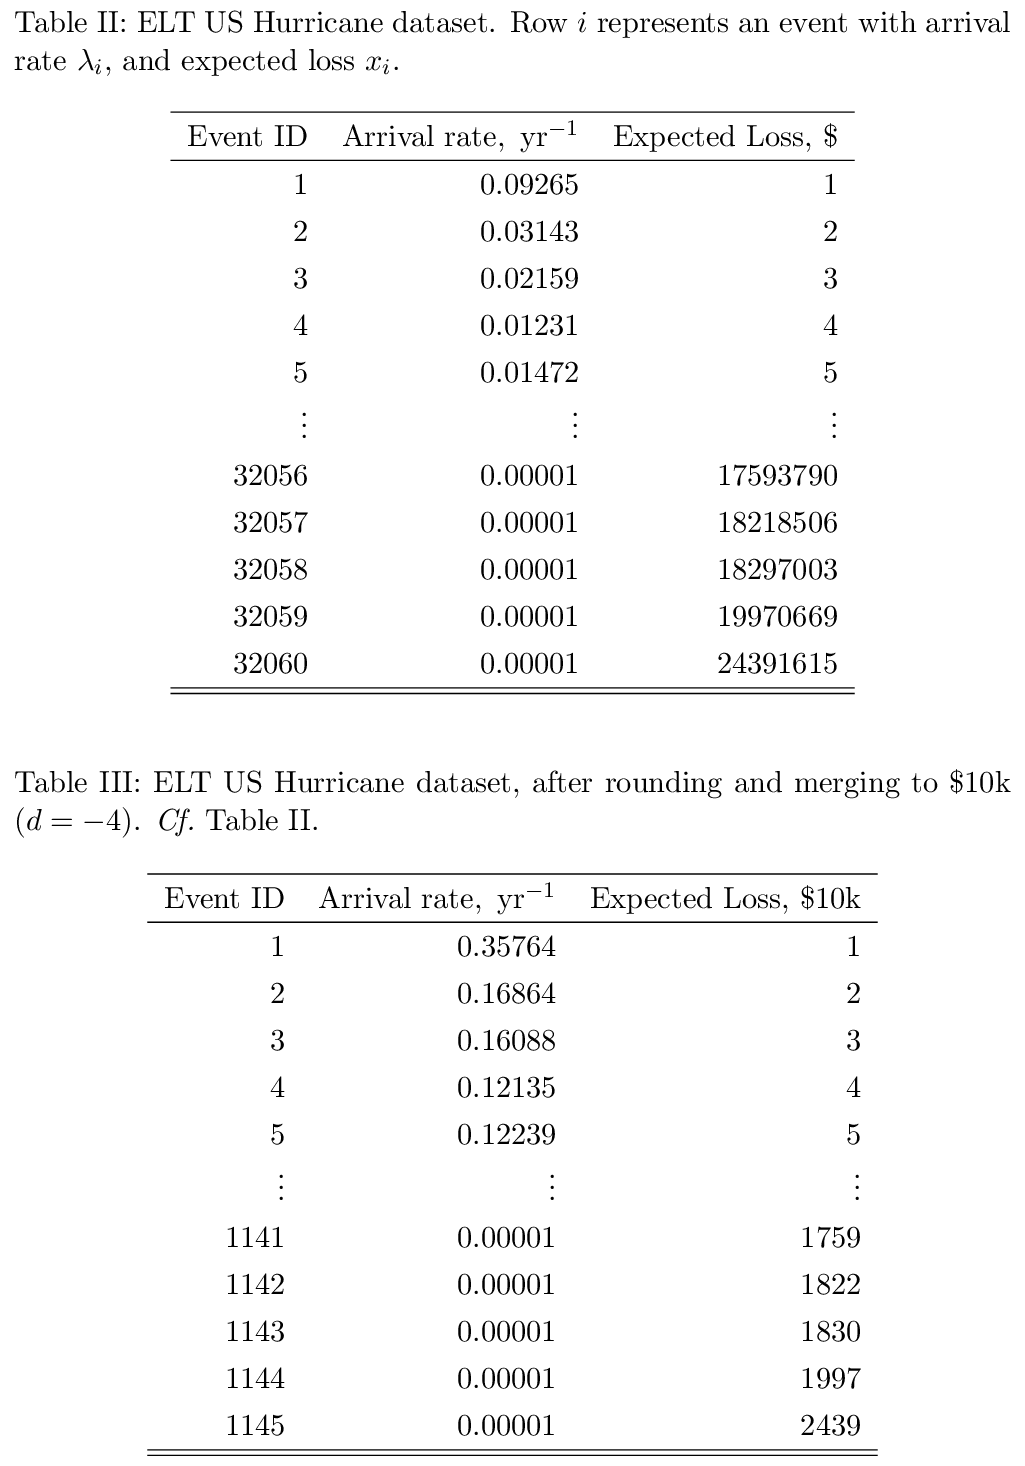
A DecL vector of 450 elements parses, and one of 500 exceeds Python’s recursion limit inside the parser, as Table 17 shows for the version of
aggregatenamed in the preface. The full table, 32,060 rows, and even the table at \(d = -4\), 1,145 rows, are beyond that limit, which is why this chapter builds them through theAggregateclass. The division is a reasonable one in any case: a DecL program is a model a person writes and reads, and a table of thirty thousand rows is data, which belongs in a file and in the class, which accepts vectors of any length.dsevof n equally likely losses, on the version ofaggregatenamed in the preface.