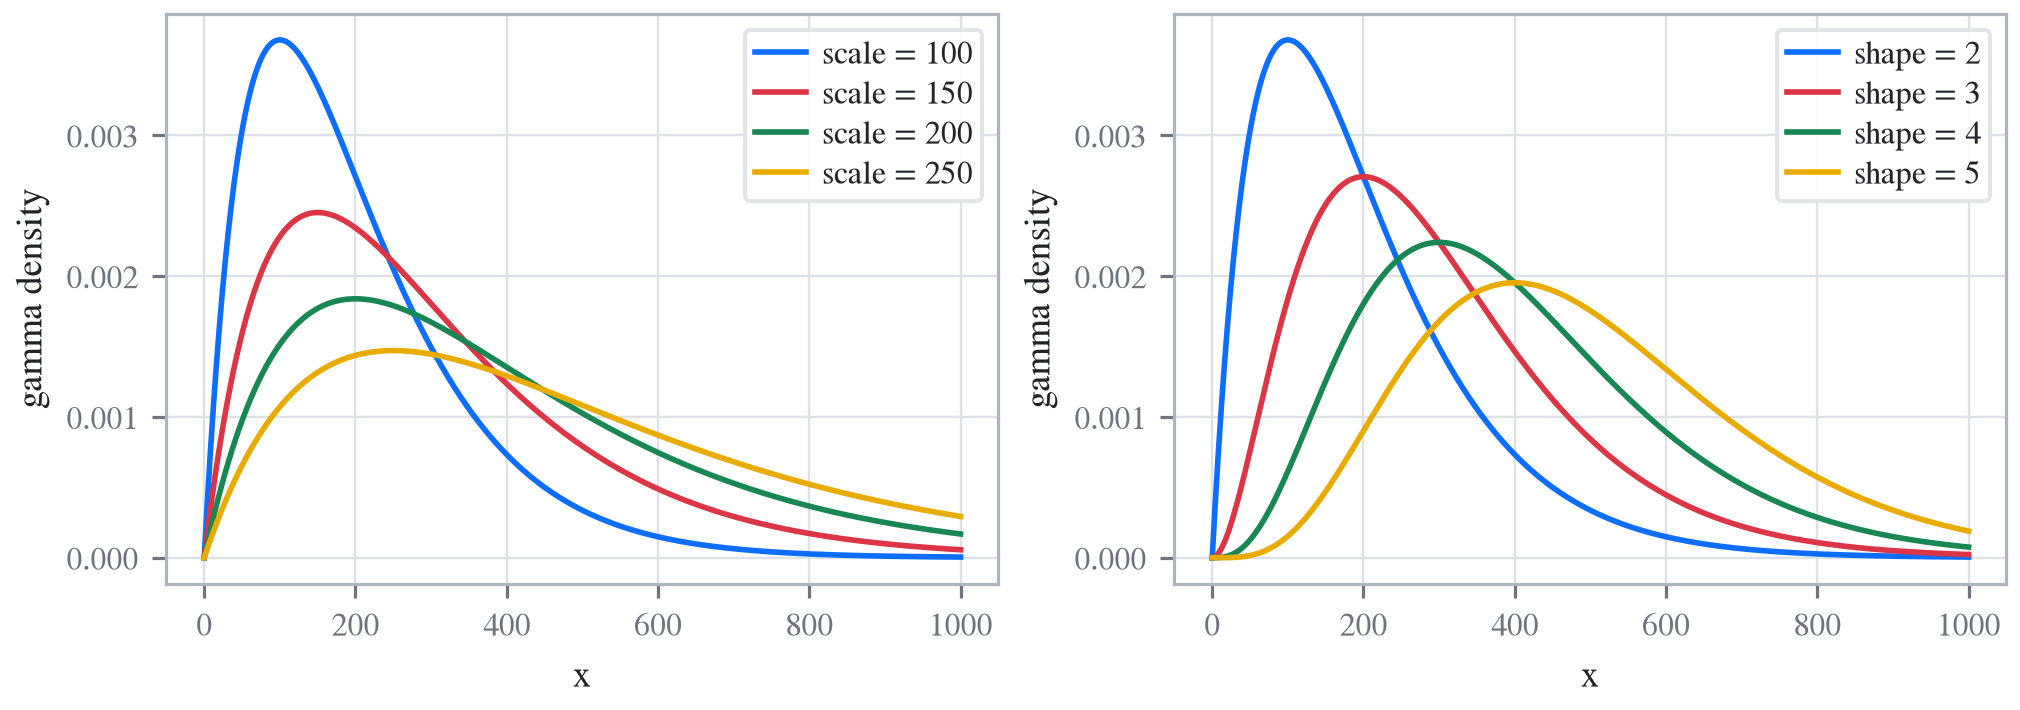
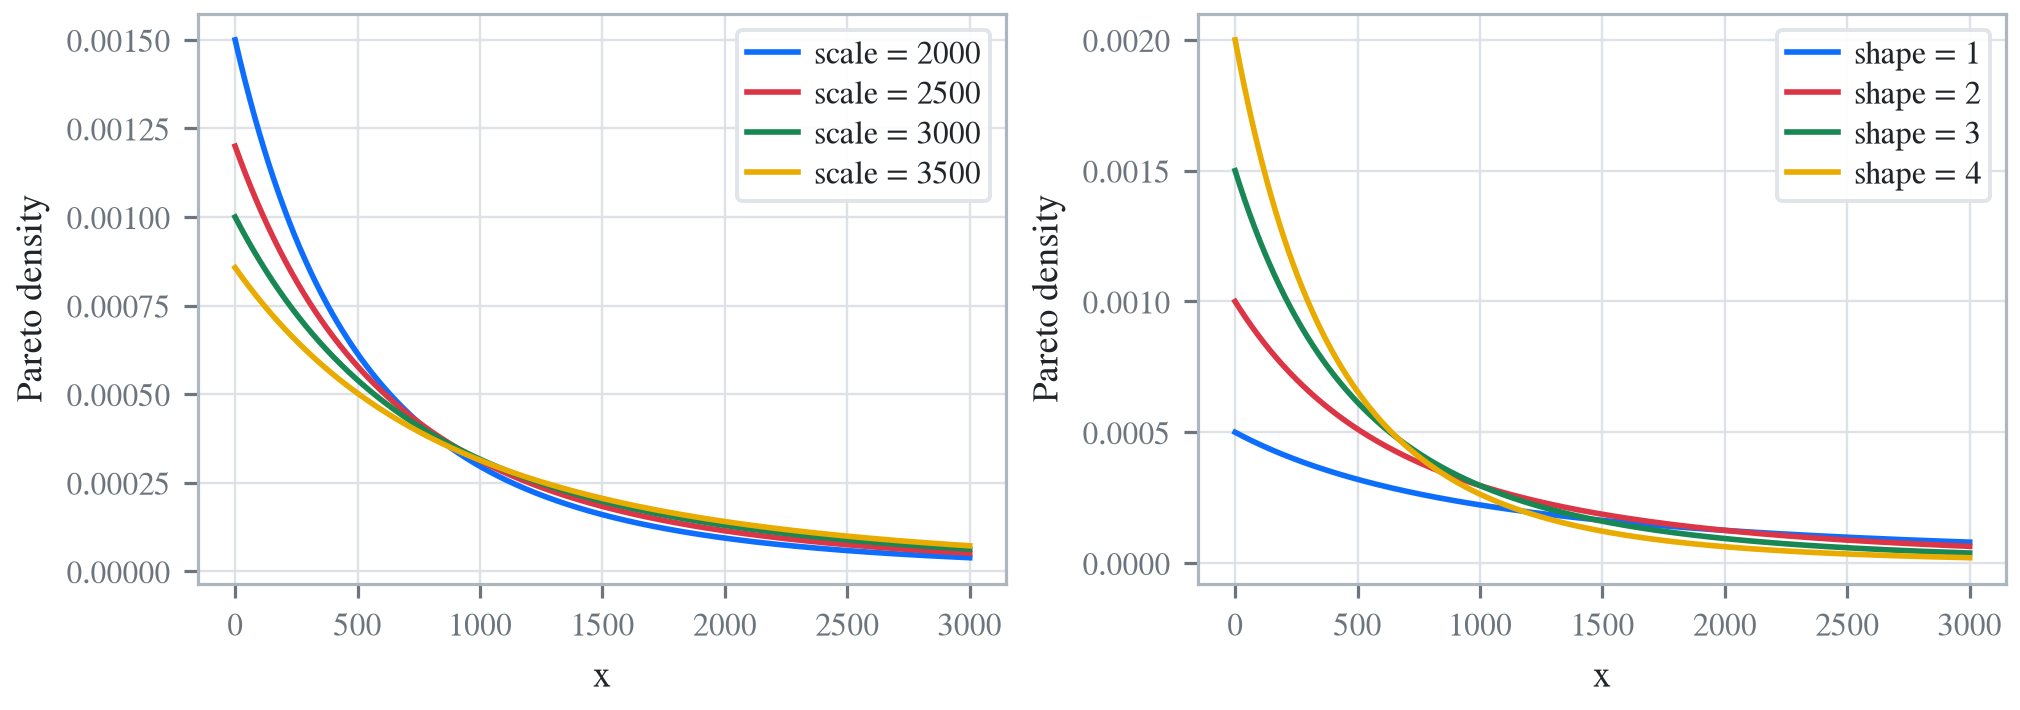
A collection of insurance policies consists of two types. 25% of policies are Type 1 and 75% of policies are Type 2. For a policy of Type 1, the loss amount per year follows an exponential distribution with mean 200, and for a policy of Type 2, the loss amount per year follows a Pareto distribution with parameters \(\alpha=3\) and \(\theta=200\). For a policy chosen at random from the entire collection of both types of policies, find the probability that the annual loss will be less than 100, and find the average loss.
Solution. The function pmv (print mean and variance) is a convenience.
This example has a very thick tailed severity and it is best to specify normalized=False for the most accurate severity estimates. With default settings, aggregate suffers considerable discretization error, with an estimated mean well below the actual 125. The sev.cdf method exposes the actual underlying severity distribution cdf functions and reproduces the requested probability exactly. The object cdf function relies on the discretization and so is shifted by half a bucket size. (Also available: sev.sf and sev.pdf.)
A claim severity distribution is exponential with mean 1000. An insurance company will pay the amount of each claim in excess of a deductible of 100. Calculate the variance of the amount paid by the insurance company for one claim, including the possibility that the amount paid is 0.
Solution. In this case we must use unconditional severity to include the possibility that the amount paid is 0. This is done by adding ! at the end of the severity specification. The moments are computed exactly without updating.
The insurance has an ordinary deductible of 4 per loss.
\(Y^{P}\) is the claim payment per payment random variable.
Solution. The trick here is to realize that \(X\) is a beta variable with \(\alpha=2\) and \(\beta=1\).
a = build('agg lda.3.4.2 1 claim 6 xs 4 sev 10 * beta 2 1 fixed')qd(a)mv(a)
Aggregate object: lda.3.4.2. Frequency distribution fixed. Severity
beta, [0, 6], bounded; 6 xs 4. Updated with bucket size 1/8,192 and log2
= 16. Validation: not unreasonable.

       Mean     SD      CV     Skew     P01 Median    P99
X
Freq      1      0       0
Sev  3.4286 1.6782 0.48947 -0.29313 0.10364 3.6157 5.9579
Agg  3.4286 1.6782 0.48947 -0.29313 0.10364 3.6157 5.9579
mean     = 3.42857
variance = 2.816327
std dev  = 1.67819
Limit Example (3.4.4)
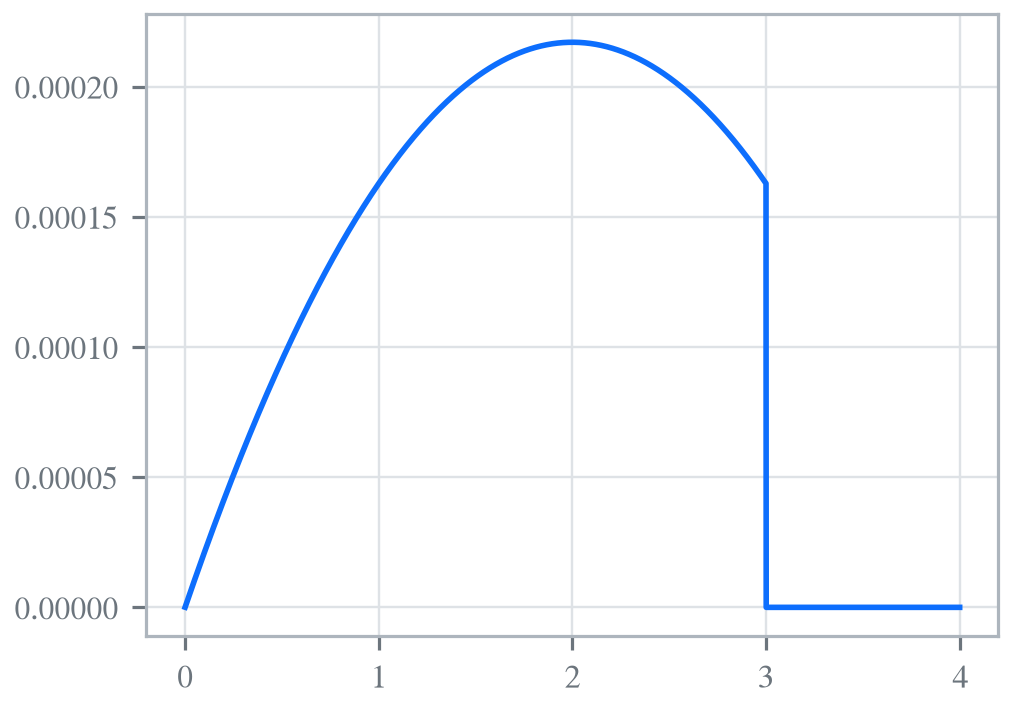
Under a group insurance policy, an insurer agrees to pay 100% of the medical bills incurred during the year by employees of a small company, up to a maximum total of one million dollars. The total amount of bills incurred, \(X\), has pdf
where \(x\) is measured in millions. Calculate the total amount, in millions of dollars, the insurer would expect to pay under this policy.
Solution. In this case the distribution has no obvious parametric form, though it is related to a beta. We can solve it in aggregate by using a custom empirical distribution.
When the empirical distribution has many entries it is faster to build the Aggregate object directly, rather than use DecL. The moments of the severity and aggregate distribution are computed from the numerical approximation during creation. There is no need to update the object.
aggregate object name    Example
value_type               loss
claim count              1.000
frequency distribution   fixed
severity distribution    dhistogram, [0, 4], bounded; 8192 atoms [0 0.000488281 0.000976562 ... 3.99902 3.99951] on [0, 3.99951]
approximate              exact
bs                       n/a
log2                     n/a
padding                  n/a
sev_calc                 n/a
dsev_bucket              linear
normalize                n/a
x_min                    n/a
x_max                    n/a
premium                  n/a
expected loss            n/a
loss ratio               n/a
P(X=0)                   n/a
validation_eps           0.0001
reinsurance              none
occurrence reinsurance   no reinsurance
aggregate reinsurance    no reinsurance
validation               n/a, not updated
frequency tail           fixed, count [1, 1], bounded
severity tail            dhistogram, [0, 4], bounded
aggregate tail           [0, 4], bounded; not concentrated (cv=0.183)
bounded                  True
id                       DC24AC39
        Mean      SD     CV    Skew  P01  Median  P99
X
Freq       1       0      0     NaN  NaN     NaN  NaN
Sev  0.93514 0.17076 0.1826 -2.9019  NaN     NaN  NaN
Agg  0.93514 0.17076 0.1826 -2.9019  NaN     NaN  NaN
Limit and Deductible Example (3.4.5)
The ground up loss random variable for a health insurance policy in 2006 is modeled with \(X\), a random variable with an exponential distribution having mean 1000. An insurance policy pays the loss above an ordinary deductible of 100, with a maximum annual payment of 500. The ground up loss random variable is expected to be 5% larger in 2007, but the insurance in 2007 has the same deductible and maximum payment as in 2006. Find the percentage increase in the expected cost per payment from 2006 to 2007.
Solution. Trend increases the ground-up severity distribution but not the limit and attachment. The calculation is performed exactly on creation; again, there is no need to update the Aggregate object.
            Mean     SD      CV    Skew  P01  Median  P99
     X
2006 Freq      1      0       0     NaN  NaN     NaN  NaN
     Sev  393.47 159.97 0.40656 -1.1717  NaN     NaN  NaN
     Agg  393.47 159.97 0.40656 -1.1717  NaN     NaN  NaN
2007 Freq      1      0       0     NaN  NaN     NaN  NaN
     Sev   397.8 157.89 0.39691 -1.2342  NaN     NaN  NaN
     Agg   397.8 157.89 0.39691 -1.2342  NaN     NaN  NaN
np.float64(0.011000207063778467)
Reinsurance Example (3.4.6, modified)
Losses arising in a certain portfolio have a two-parameter Pareto distribution with \(\alpha=5\) and \(\theta=3,600\). A reinsurance arrangement has been made, under which (a) the reinsurer accepts 15% of losses up to \(u=5,000\) and all amounts in excess of 5,000 and (b) the insurer pays for the remaining losses.
Express the random variables for the reinsurer’s and the insurer’s payments as a function of \(X\), the portfolio losses.
Calculate the mean amount paid on a single claim by the insurer.
Calculate the standard deviation of the amount paid on a single claim by the insurer (retaining the 15% copayment).
Solution. The net position can be modeled as:
agg insurer.net 1 claim
sev 3600 * pareto 5 - 3600
occurrence net of 15% po 5000 xs 0 and inf xs 5000
fixed
but this involves the thick-tailed Pareto across its entire range. It is better to recognize the severity is limited by the second excess layer and proceed as follows.
a = build('agg insurer.net 1 claim ''5000 xs 0 sev 3600 * pareto 5 - 3600 ''occurrence net of 15% po 5000 xs 0 ''fixed')qd(a)print('\n', a.actual_m, a.actual_sd)
Aggregate object: insurer.net. Frequency distribution fixed. Severity
pareto, [0, 5,000], bounded; 5,000 xs 0. Updated with bucket size 1/8
and log2 = 16. Validation: reinsurance; subject not unreasonable.

       Mean     SD     CV   Skew   P01 Median  P99
X
Freq      1      0      0
Sev  741.51 834.64 1.1256 2.0952 6.125    455 4250
Agg  741.51 834.64 1.1256 2.0952 6.125    455 4250

 872.3650484486673 981.9314221673877
Note
In DecL a percentage is a share and a plain number is an amount. 15% po 5000 xs 0 places 15% of the layer 5,000 xs 0, and 750 po 5000 xs 0 places the same 15% as an amount, 750 of the 5,000 limit. A decimal written in place of the percentage, 0.15 po 5000 xs 0, is therefore read as an amount of 0.15, a placement of 0.003% of the layer, and aggregate warns when a placement is that small. The insurer’s mean checks by hand: it is \(0.85\,\mathsf{P}(X \wedge 5000) = 0.85 \times 900\,(1 - (3600/8600)^4) = 0.85 \times 872.37 = 741.51\).
4 Aggregate Loss Distributions
Poisson/Discrete Example (5.3.1)
The number of accidents follows a Poisson distribution with mean 12. Each accident generates 1, 2, or 3 claimants with probabilities 1/2, 1/3, and 1/6 respectively.
Calculate the variance in the total number of claimants.
Aggregate object: QU. Frequency distribution poisson. Severity
dhistogram, [1, 3], bounded; atoms [1 2 3]. Updated with bucket size 1
and log2 = 7. Validation: not unreasonable.

       Mean      SD      CV    Skew P01 Median P99
X
Freq     12  3.4641 0.28868 0.28868
Sev  1.6667 0.74536 0.44721  0.6261   1      1   3
Agg      20  6.3246 0.31623 0.36366   7     20  36
mean     = 20
variance = 40
std dev  = 6.32456
As always, a contains the (exact) full distribution of outcomes. We could answer any question about it.
Discrete Example (5.3.2)
You are the producer of a television quiz show that gives cash prizes. The number of prizes, \(N\), and prize amount, \(X\), have the following distributions:
Frequency distribution empirical. Severity dhistogram, [0, 1,000], bounded; atoms [0 100 1000]. Validation: n/a, not updated.
Summary
Mean
SD
CV
Skew
P01
Median
P99
X
Freq
1.2
0.4
0.33333
1.5
Sev
170
279.46
1.6439
2.5637
Agg
204
313.6
1.5372
2.3992
mean     = 204
variance = 98344
std dev  = 313.598
517.5984693840198
Geometric/Discrete Example (5.3.3 and 5.4.1)
The number of claims in a period has a geometric distribution with mean \(4\). The amount of each claim \(X\) follows \(\Pr(X=x) = 0.25, \ x=1,2,3,4\), i.e. a discrete uniform distribution on \(\{1,2,3,4\}\). The number of claims and the claim amounts are independent. Let \(S_N\) denote the aggregate claim amount in the period. Calculate \(F_{S_N}(3)\).
Solution. We can compute the entire distribution. Here we show up to the 99th percentile. If the probability clause in dsev is omitted then all outcomes are treated as equally likely.
ex         80000
var    1.024e+09
sd         32000
cv           0.4
prob     0.10565
Poisson/Uniform Example (5.3.5 and 5.4.2)
For an individual over 65:
The number of pharmacy claims is a Poisson random variable with mean 25.
The amount of each pharmacy claim is uniformly distributed between 5 and 95.
The amounts of the claims and the number of claims are mutually independent.
Estimate the probability that aggregate claims for this individual will exceed 2000 using the normal approximation.
Solution. Here is a close-to exact solution in addition to the normal approximation. Note that the uniform distribution has no shape parameter. The severity is made by shifting and scaling the base. Scaling is like multiplication and is applied before the location (addition) shift.
a = build('agg Pharma 25 claims sev 90 * uniform + 5 poisson')qd(a)
Aggregate object: Pharma. Frequency distribution poisson. Severity
uniform, [0, 95], bounded. Updated with bucket size 1/8 and log2 = 16.
Validation: not unreasonable.

      Mean     SD      CV    Skew    P01 Median    P99
X
Freq    25      5     0.2     0.2
Sev     50 25.981 0.51962       0  5.875     50 94.125
Agg   1250 281.74 0.22539 0.25293 649.62 1238.1 1955.8
Here are the moments for the approximation. The approximate function returns a scipy.stats frozen normal object, which yields the approximation.
approximate will also provide (shifted) gamma and lognormal fits.
approx = a.approximate('all')b = pd.DataFrame([[k, v.sf(2000)] for k, v in approx.items()], columns=['approx', 'prob']).set_index('approx')b.loc['exact'] = a.sf(2000)b.sort_values('prob')
prob
approx
norm
0.003883
exact
0.006980
sgamma
0.007101
slognorm
0.007175
gamma
0.009789
lognorm
0.013118
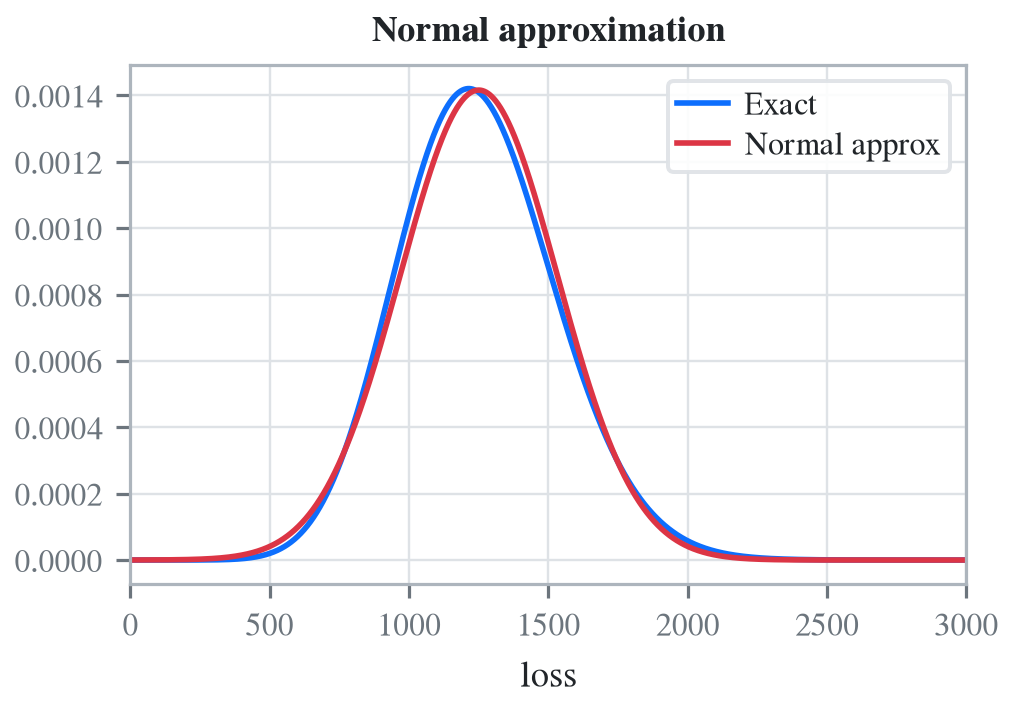
Here is a comparison of the FFT model with the normal approximation. Example 5.4.2 derives a similar probability using simulation.
In a given week, the number of projects that require you to work overtime has a geometric distribution with \(\beta=2\). For each project, the distribution of the number of overtime hours in the week, \(X\), is as follows:
The number of projects and the number of overtime hours are independent. You will get paid for overtime hours in excess of 15 hours in the week. Calculate the expected number of overtime hours for which you will get paid in the week.
Solution. This is a one-liner in aggregate. Remember that aggregate reinsurance is specified after the frequency clause. The first column in the describe dataframe shows the analytic gross answer and the second the FFT-computed net.
a = build('agg Projects 2 claims ''dsev [5 10 20] [.2 .3 .5] geometric ''aggregate net of 15 xs 0')qd(a)
Aggregate object: Projects. Frequency distribution geometric. Severity
dhistogram, [5, 20], bounded; atoms [5 10 20]. Updated with bucket size
5 and log2 = 7. Validation: reinsurance; subject not unreasonable.

       Mean     SD      CV     Skew P01 Median P99
X
Freq      2 2.4495  1.2247   2.0412
Sev      14  6.245 0.44607 -0.23403   5     10  20
Agg  18.807 31.433  1.6713   2.6377   0      5 140
Example 5.3.7 uses a recursive calculation in steps of 5. We can replicate that using an aggregate excess cover. The cumulative excess (overtime) at attachment A is the ceded mean of an aggregate ceded to inf xs A cover, read from reins_summary_df (the ('agg', 'ceded', 'agg') row, column Est EX).
import numpy as nprows = []for A in [0, 5, 10, 15]: aA = build('agg Projects.1 2 claims ''dsev [5 10 20] [.2 .3 .5] geometric 'f'aggregate ceded to inf xs {A}') rows.append([A, aA.reins_summary_df.loc[('agg', 'ceded', 'agg'), 'Est EX']])b = pd.DataFrame(rows, columns=['attach', 'cumul ex']).set_index('attach')qd(b, accuracy=4)
        cumul ex
attach
0             28
5         24.667
10        21.556
15        18.807
Note
This example previously used the per-layer reinsurance_audit_df, removed in 1.0.0a19 in favour of the whole-structure reins_summary_df / reins_stats_df / reins_density_df objects. The excess at each attachment is recovered above by building one ceded to inf xs A cover per attachment and reading its ceded aggregate mean.
Zero-Modified Poisson/Burr Example (5.5.4)
Aggregate losses are modeled as follows:
The number of losses follows a zero-modified Poisson distribution with \(\lambda=3\) and \(p_0^M = 0.5\).
The amount of each loss has a Burr distribution with \(\alpha=3, \theta=50, \gamma=1\).
There is a deductible of \(d=30\) on each loss.
The number of losses and the amounts of the losses are mutually independent.
Calculate \(\mathsf{E}(N^P)\) and \(\mathsf{Var}(N^P)\).
Solution. This is a pure frequency question: the deductible thins the loss count \(N^L\) into the payment count \(N^P\). The problem states the zero-modified Poisson the textbook way (base parameter \(\lambda=3\) plus the modified zero mass \(p_0^M\)), which is exactly how DecL reads it: the exposure clause gives the un-modified mean and the \((a,b,1)\) reweighting moves it. So 3 claims ... poisson zm 0.5 is a base Poisson(3), and \(\mathsf{E}(N^L)\) is an output.
import scipy.stats as ss# Burr(alpha=3, theta=50, gamma=1) is scipy's burr12(c=gamma, d=alpha)burr = ss.burr12(1, 3, scale=50)v = burr.sf(30) # survival at the deductiblev
np.float64(0.24414062499999994)
The frequency carries the whole calculation. apply_deductible implements the Loss Models §8.6 map: the base parameter scales by \(v\) and the zero mass becomes \(\alpha^* = P_{N^L}(1-v)\).
The deductible has made “no payment this period” much more likely (\(p_0^{M*} = 0.7268\) against \(p_0^M = 0.5\)), which is the general rule of Loss Models §8.6: a zero-truncated loss count always yields a zero-modified payment count.
As a check, any independent-thinning model must satisfy \(\mathsf{E}(N^P) = v\,\mathsf{E}(N^L)\) and \(\mathsf{Var}(N^P) = v^2\mathsf{Var}(N^L) + v(1-v)\mathsf{E}(N^L)\), which is an entirely different route to the same two numbers.
f1, f2, _ = loss_count.freq_moms(loss_count.base_mean)var_nl = f2 - f1 * f1v * f1, v **2* var_nl + v * (1- v) * f1
Negative Binomial Example (5.5.5 and 5.5.6 modified)
A group dental policy has a negative binomial claim count distribution with mean 300 and variance 800. Ground-up severity is given by the following table:
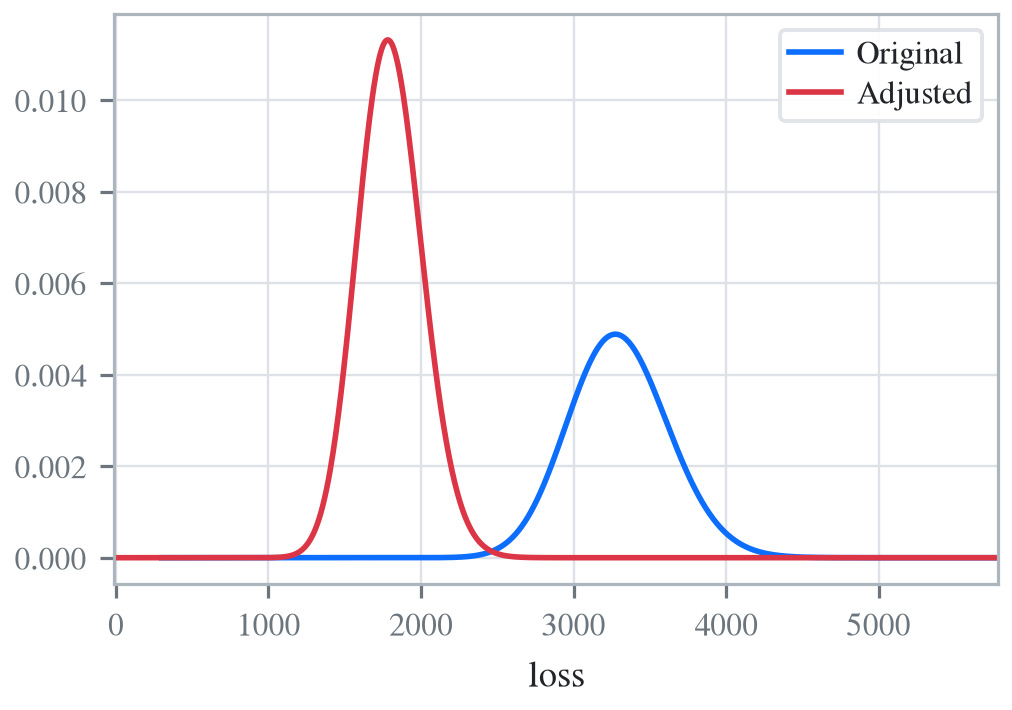
You expect severity to increase 50% with no change in frequency. You decide to impose a per claim deductible of 100. Calculate the expected total claim payment \(S\) after these changes. What is the variance of the total claim payment, \(\mathsf{Var}(S)\)? (Modified:) Compare the aggregate distributions before and after the policy change.
Solution. A negative binomial with mean 300 and variance 800 has \(8/3 = 1 + 300c\) and giving a mixing cv of \(\sqrt{c}=(5/900)^{0.5}=0.0745\). Hence the aggregate program is
Poisson/Exponential Coverage and Underwriting Modification (Example 5.5.7)
A company insures a fleet of vehicles. Aggregate losses have a compound Poisson distribution. The expected number of losses is 20. Loss amounts, regardless of vehicle type, have exponential distribution with \(\theta=200\). To reduce the cost of the insurance, two modifications are to be made:
A certain type of vehicle will not be insured. It is estimated that this will reduce loss frequency by 20%.
A deductible of 100 per loss will be imposed.
Calculate the expected aggregate amount paid by the insurer after the modifications.
Solution. The ! at the end of the severity clause indicates unconditional severity (including zero claims that fail to meet the deductible).
a = build(f'agg Auto {20*0.8} claims inf xs 100 sev 200 * expon ! poisson')qd(a)
Aggregate object: Auto. Frequency distribution poisson. Severity expon,
[0, inf), exponential right tail; inf xs 100. Updated with bucket size
1/4 and log2 = 16. Validation: not unreasonable.

       Mean     SD      CV    Skew    P01 Median    P99
X
Freq     16      4    0.25    0.25
Sev  121.31 183.87  1.5157  2.4172      0  38.75    821
Agg  1940.9 881.11 0.45397 0.68096 364.25   1840 4408.2
If severity is conditional there are 16 claims in excess of the deductible, giving a much higher number. The mean severity is still 200 because of the exponential’s memoryless property.
a = build(f'agg Auto {20*0.8} claims inf xs 100 sev 200 * expon poisson')qd(a)
Aggregate object: Auto. Frequency distribution poisson. Severity expon,
[0, inf), exponential right tail; inf xs 100. Updated with bucket size
1/2 and log2 = 16. Validation: not unreasonable.

      Mean     SD      CV    Skew  P01 Median    P99
X
Freq    16      4    0.25    0.25
Sev    200    200       1       2    2  138.5    921
Agg   3200 1131.4 0.35355 0.53033 1033 3099.5 6254.5
5 Portfolio Management
VaR for a Discrete Variable Example (10.3.4)
Consider an insurance loss random variable with the following probability distribution:
You are the Chief Risk Officer of a telecommunications firm. Your firm has several property and liability risks. We will consider:
\(X_1\), buildings, modeled using a gamma distribution with mean 200 and scale parameter 100.
\(X_2\), motor vehicles, modeled using a gamma distribution with mean 400 and scale parameter 200.
\(X_3\), directors and executive officers risk, modeled using a Pareto distribution with mean 1000 and scale parameter 1000.
\(X_4\), cyber risks, modeled using a Pareto distribution with mean 1000 and scale parameter 2000.
Denote the total risk as \(X = X_1 + X_2 + X_3 + X_4\). For simplicity, you assume that these risks are independent. (Later, we will consider the more complex case of dependence.)
To manage the risk, you seek some insurance protection. You wish to manage internally small building and motor vehicles amounts, up to \(M_1\) and \(M_2\), respectively. You seek insurance to cover all other risks. Specifically, the insurer’s portion is
so that your retained risk is \(Y_{retained}= X - Y_{insurer} = \min(X_1,M_1) + \min(X_2,M_2)\). Using deductibles \(M_1=\) 100 and \(M_2=\) 200:
Determine the expected claim amount of (i) that retained, (ii) that accepted by the insurer, and (iii) the total overall amount.
Determine the 80th, 90th, 95th, and 99th percentiles for (i) that retained, (ii) that accepted by the insurer, and (iii) the total overall amount.
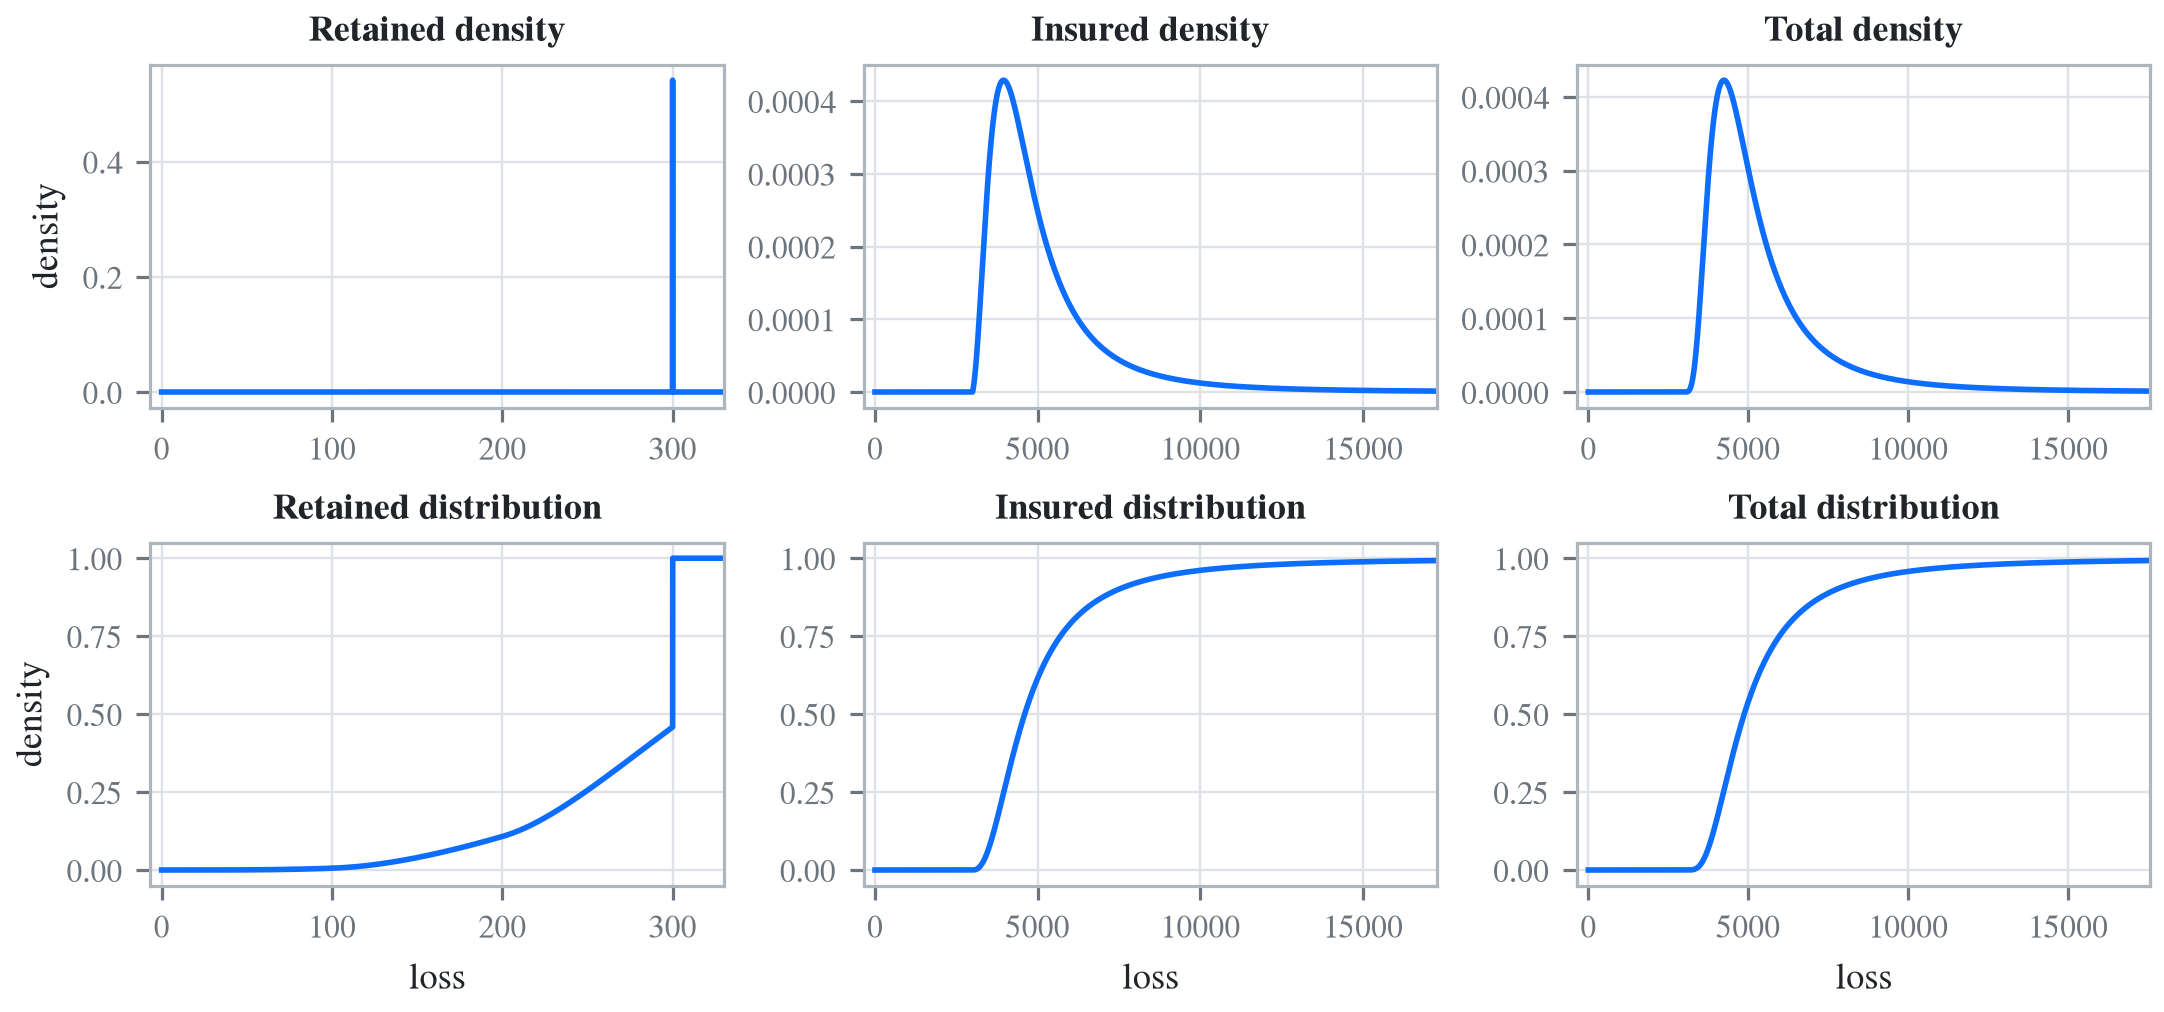
Compare the distributions by plotting the densities for (i) that retained, (ii) that accepted by the insurer, and (iii) the total overall amount.
Solution. Begin by figuring the gamma and Pareto parameters. For a gamma, the mean equals shape times scale, so shape equals 2 for building and motor. For a Pareto, the mean equals scale / (shape - 1), so shape equals 2 (no variance) for D&O and 3 for cyber (no third moment). The text’s figures, however, come from a Pareto that starts at its scale rather than at zero: substituting it adds the two scales, 3,000, to every percentile of the total, and the text’s expected losses of 269.05 retained, 5274.41 insured, and 5543.46 in total sit there, not at the 2,600 total the stated parameters imply. In DecL that Pareto is 1000 * pareto 2 without the shift - 1000 used elsewhere in this chapter, and the programs below follow the text’s figures. We model the results using three Portfolio objects, one for the retention, one for the insured amount, and one total. In each case the distribution gives total losses; the frequency component is trivial.
Since the insured and total aggregates have no variance it is hard to estimate an appropriate bucket size. The default method uses the standard deviation as a scale factor. We must use judgement (or trial and error), and select log2=18 and bs=1 to ensure there is enough “space”. Checking the describe dataframe shows these values match the means well by unit and in total. The insured severity must be made unconditional.
retained = build('''port retained agg building 1 claim 100 xs 0 sev 100 * gamma 2 fixed agg motor 1 claim 200 xs 0 sev 200 * gamma 2 fixed''')qd(retained)insured = build('''port insured agg building 1 claim inf xs 100 sev 100 * gamma 2 ! fixed agg motor 1 claim inf xs 200 sev 200 * gamma 2 ! fixed agg d.and.o 1 claim sev 1000 * pareto 2 fixed agg cyber 1 claim sev 2000 * pareto 3 fixed''', log2=18, bs=1)qd(insured)total = build('''port total agg building 1 claim sev 100 * gamma 2 fixed agg motor 1 claim sev 200 * gamma 2 fixed agg d.and.o 1 claim sev 1000 * pareto 2 fixed agg cyber 1 claim sev 2000 * pareto 3 fixed''', log2=18, bs=1)qd(total)
Portfolio object: retained. Contains 2 aggregate components. Updated
with bucket size 1/128 and log2 = 16. Validation: not unreasonable.

                Mean     SD      CV    Skew    P01 Median P99
unit     X
building Freq      1      0       0
         Sev  89.636   21.5 0.23985 -2.1029 14.859    100 100
         Agg  89.636   21.5 0.23985 -2.1029 14.859    100 100
motor    Freq      1      0       0
         Sev  179.27 42.999 0.23985 -2.1029 29.711    200 200
         Agg  179.27 42.999 0.23985 -2.1029 29.711    200 200
total    Agg  268.91 48.075 0.17878 -1.6928 112.55    300 300
Portfolio object: insured. Contains 4 aggregate components. Updated with
bucket size 1 and log2 = 18. Validation: fails sev mean, agg mean.

                Mean     SD      CV   Skew  P01 Median   P99
unit     X
building Freq      1      0       0
         Sev  110.36 131.34  1.1901  1.757    0     68   564
         Agg  110.36 131.34  1.1901  1.757    0     68   564
motor    Freq      1      0       0
         Sev  220.73 262.68  1.1901  1.757    0    136  1128
         Agg  220.73 262.68  1.1901  1.757    0    136  1128
d.and.o  Freq      1      0       0
         Sev  1992.4 2677.4  1.3438 24.569 1005   1414  9993
         Agg  1992.4 2677.4  1.3438 24.569 1005   1414  9993
cyber    Freq      1      0       0
         Sev  2999.8 1705.7 0.56861 12.863 2007   2520  9283
         Agg  2999.8 1705.7 0.56861 12.863 2007   2520  9283
total    Agg  5323.3   3188 0.59888 16.519 3217   4601 15706
Portfolio object: total. Contains 4 aggregate components. Updated with
bucket size 1 and log2 = 18. Validation: fails sev mean, agg mean.

                Mean     SD      CV   Skew  P01 Median   P99
unit     X
building Freq      1      0       0
         Sev     200 141.42 0.70711 1.4142   15    168   664
         Agg     200 141.42 0.70711 1.4142   15    168   664
motor    Freq      1      0       0
         Sev     400 282.84 0.70711 1.4142   30    336  1328
         Agg     400 282.84 0.70711 1.4142   30    336  1328
d.and.o  Freq      1      0       0
         Sev  1992.4 2677.4  1.3438 24.569 1005   1414  9993
         Agg  1992.4 2677.4  1.3438 24.569 1005   1414  9993
cyber    Freq      1      0       0
         Sev  2999.8 1705.7 0.56861 12.863 2007   2520  9283
         Agg  2999.8 1705.7 0.56861 12.863 2007   2520  9283
total    Agg  5592.2 3190.2 0.57047 16.485 3442   4875 15977
The spacing in the agg programs is for clarity. We could also program using dfreq as agg motor dfreq [1] 100 xs 0 sev.... Next, assemble the requested data elements.
pfs = [retained, insured, total]answers = pd.DataFrame(columns=['retained', 'insured', 'total'])answers.index.name ='statistic'answers.loc['expected claim amount'] = [x.actual_m for x in pfs]for p in [.8, .9, .95, .99]: answers.loc[f'claim p_{p:.2f}'] = [x.q(p) for x in pfs]qd(answers)
Finally, plot the densities. Compared to the text plot, the FFT reveals a discontinuous distribution for retained loss, with a large mass at 300. This is clearer on the lower plots, which show the distribution functions.
fig, axs = plt.subplots(2, 3, figsize=(7.5, 3.5), constrained_layout=True, squeeze=True)xl = {}for ax, pf inzip(axs.flat, pfs): pf.density_df.p_total.plot(ax=ax)# compute and store a reasonable x range q = pf.q(0.99) *1.1 xl[hash(pf)] = [-q /50, q] ax.set(xlim=xl[hash(pf)], title=pf.name.title() +' density')if pf is retained: ax.set(ylabel='density')for ax, pf inzip(axs.flat[3:], pfs): pf.density_df.F.plot(ax=ax) ax.set(xlim=xl[hash(pf)], title=pf.name.title() +' distribution', xlabel='loss')if pf is retained: ax.set(ylabel='density')
Programs in the aggregate Loss Lab
Each program below opens in the aggregate Loss Lab, which builds it with nothing to install. The names are those in recitations.agg, where every program is renamed by its text’s citation key, or by Exam for an examination question.