from aggregate import qd, mv
import matplotlib.pyplot as pltBahnemann on aggregate distributions and layer pricing
Bahnemann (2015), Distributions for Actuaries, CAS Monograph 2, Chapters 4 to 6
Examples from the CAS published monograph Bahnemann (2015), Distributions for actuaries, which is a text for CAS Part 8. It is available for free on the CAS Website.
1 Simple Discrete Aggregate, Example 4.1
Assume that n = 0, 1, 2 are the only possible numbers of claims and they occur with probabilities 0.6, 0.3 and 0.1, and that there exist just three potential claim sizes: 1, 2, and 3 with probabilities 0.4, 0.5 and 0.1. (Note: the text uses claim sizes 100, 200 and 300.) Compute the distribution of possible outcomes and its mean and variance.
Imports and convenience functions.
Build the aggregate and display key statistics.
a = build('agg Bahn.4.1 dfreq[0 1 2][.6 .3 .1] '
          'dsev[1 2 3][.4 .5 .1]')
qd(a)
mv(a)
Aggregate object: Bahn.4.1. Frequency distribution empirical. Severity
dhistogram, [1, 3], bounded; atoms [1 2 3]. Updated with bucket size 1
and log2 = 3. Validation: not unreasonable.
Mean SD CV Skew P01 Median P99
X
Freq 0.5 0.67082 1.3416 0.99381
Sev 1.7 0.64031 0.37665 0.36568 1 2 3
Agg 0.85 1.227 1.4435 1.3333 0 0 5
mean = 0.85
variance = 1.5055
std dev = 1.22699Display all possible outcomes. Compare with the table on p. 107.
qd(a.density_df.query('p_total > 0') [['p_total', 'F']])
      p_total     F
loss
0.0       0.6   0.6
1.0      0.12  0.72
2.0     0.166 0.886
3.0      0.07 0.956
4.0     0.033 0.989
5.0      0.01 0.999
6.0     0.001     1
2 Poisson-Gamma (Tweedie) Aggregate, Example 4.2
The text considers a Tweedie with expected claim count \(\lambda=2.5\) and gammma shape 3 and scale 400. It computes the mean, variance and skewness, and uses the series expansion for the distribution to compute the CDF at various points (Table 4.1). These results can be replicated as follows.
a = build('agg Bahn.4.2 2.5 claims '
          'sev 400 * gamma 3 poisson')
qd(a)
mv(a)
Aggregate object: Bahn.4.2. Frequency distribution poisson. Severity
gamma, [0, inf), exponential right tail. Updated with bucket size 1 and
log2 = 16. Validation: not unreasonable.
Mean SD CV Skew P01 Median P99
X
Freq 2.5 1.5811 0.63246 0.63246
Sev 1200 692.82 0.57735 1.1547 174 1070 3362
Agg 3000 2190.9 0.7303 0.91287 0 2657 9435
mean = 3000
variance = 4800000
std dev = 2190.89Extract various points of the pmf, cdf, and sf. The adjustment to the index is cosmetic. aggregate returns the entire distribution. The left plot shows the mixed density, with a mass at zero; right shows the cdf.
bit = a.density_df.loc[
    sorted(np.hstack((500, np.arange(0, 10000.5, 1000)))),
    ['p', 'F', 'S']]
qd(bit, accuracy=4)
fig, axs = plt.subplots(1, 2, figsize=(3.5*2, 2.45), constrained_layout=True, squeeze=True)
ax0, ax1 = axs.flat
(a.density_df.p / a.bs).plot(ylim=[0, 0.0002], xlim=[-100, 10000], lw=2, ax=ax0)
ax0.set(title='Density')
a.density_df.F.plot(ylim=[-0.05, 1.05], xlim=[-100, 10000], lw=2, ax=ax1)
ax0.set(title='Mixed density');
ax1.set(title='Distribution function');
                 p        F         S
loss
0.0       0.082085 0.082085   0.91792
500.0   0.00011953  0.10961   0.89039
1000.0  0.00017612  0.18681   0.81319
2000.0  0.00019345  0.37563   0.62437
3000.0  0.00017303  0.56136   0.43864
4000.0  0.00013322  0.71522   0.28478
5000.0  9.1789e-05  0.82733   0.17267
6000.0  5.7942e-05  0.90137  0.098632
7000.0  3.4045e-05  0.94654  0.053459
8000.0   1.883e-05  0.97234  0.027657
9000.0  9.8863e-06  0.98628  0.013725
10000.0 4.9597e-06  0.99344 0.0065598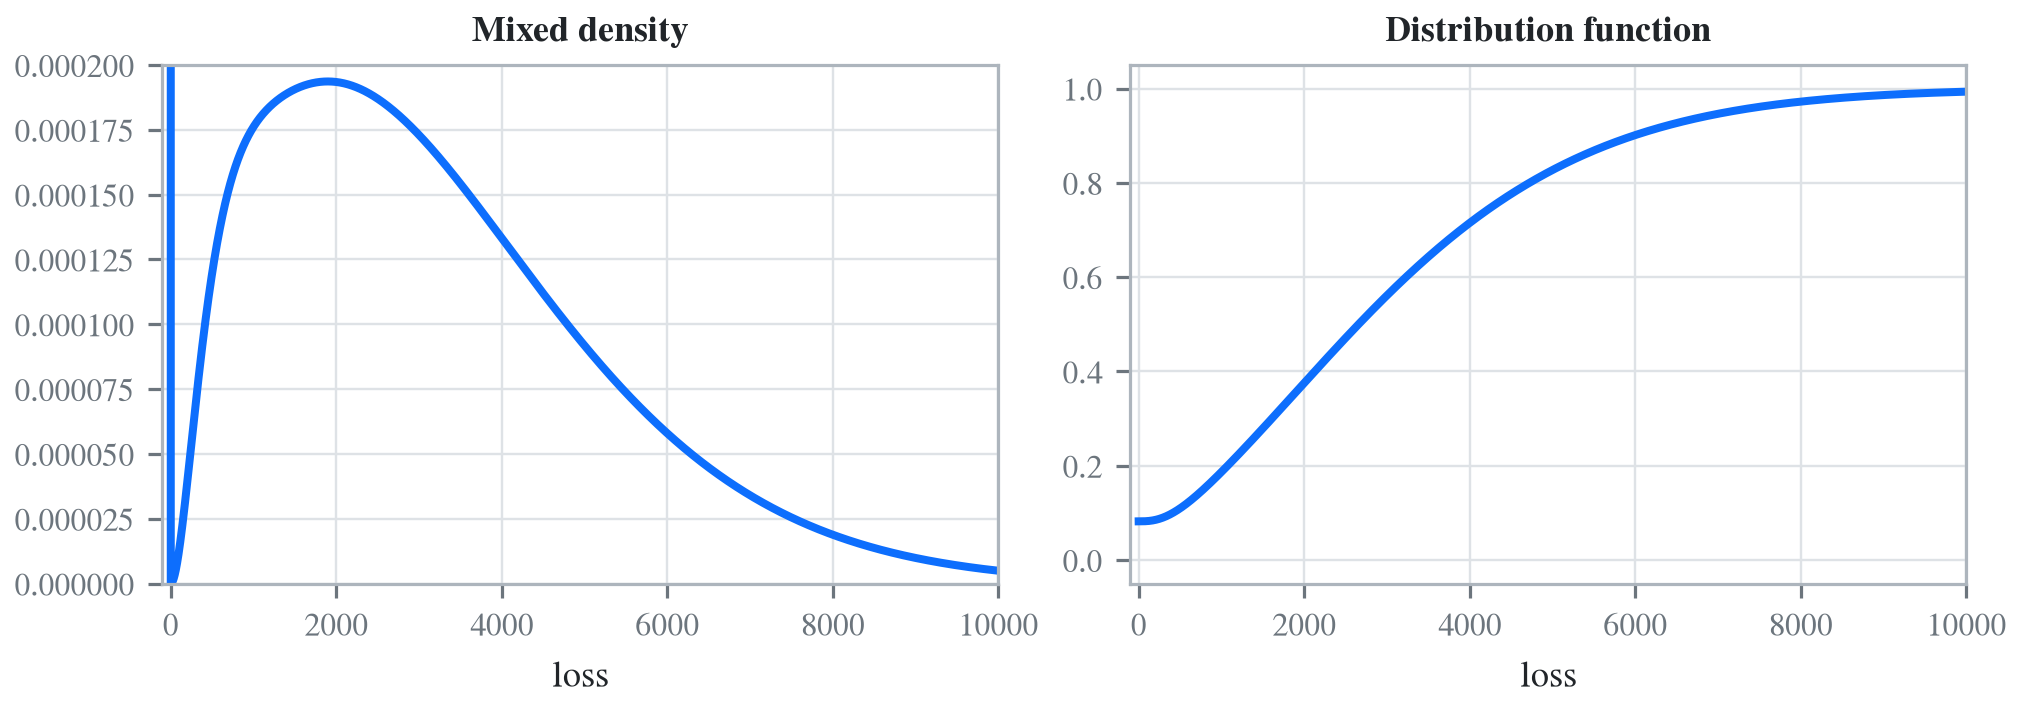
3 Approximations to the Tweedie, Example 4.3
aggregate largely circumvents the need for approximations, but it does support their creation. The following reproduces Table 4.3.
fz = a.approximate('all')
bit['Normal'] = fz['norm'].cdf(bit.index)
bit['Norm err'] = bit.Normal / bit.F - 1
bit['sGamma'] = fz['sgamma'].cdf(bit.index)
bit['sGamma err'] = bit.sGamma / bit.F - 1
qd(bit, accuracy=4)
                 p        F         S   Normal  Norm err   sGamma  sGamma err
loss
0.0       0.082085 0.082085   0.91792 0.085452  0.041016 0.045932    -0.44044
500.0   0.00011953  0.10961   0.89039  0.12692   0.15789  0.10104   -0.078199
1000.0  0.00017612  0.18681   0.81319  0.18066 -0.032961  0.17751   -0.049818
2000.0  0.00019345  0.37563   0.62437  0.32404  -0.13734  0.36803   -0.020213
3000.0  0.00017303  0.56136   0.43864      0.5  -0.10931  0.56073  -0.0011223
4000.0  0.00013322  0.71522   0.28478  0.67596 -0.054892  0.71854   0.0046408
5000.0  9.1789e-05  0.82733   0.17267  0.81934 -0.009651  0.83105    0.004497
6000.0  5.7942e-05  0.90137  0.098632  0.91455  0.014623  0.90379   0.0026876
7000.0  3.4045e-05  0.94654  0.053459  0.96606  0.020617  0.94752   0.0010376
8000.0   1.883e-05  0.97234  0.027657  0.98876  0.016885  0.97238  3.8292e-05
9000.0  9.8863e-06  0.98628  0.013725  0.99692  0.010788  0.98589 -0.00038837
10000.0 4.9597e-06  0.99344 0.0065598   0.9993 0.0058994  0.99298 -0.00046794
Here is Table 4.4. The FFT overstates \(F(0)\) because of discretization error.
a2 = build('agg Bahn.4.2b 10 claims '
           'sev 6000 * gamma 0.05 poisson')
qd(a2)
fz = a2.approximate('all')
bit = a2.density_df.loc[
    sorted(np.hstack((500, np.arange(0, 20000, 2000)))),
    ['p', 'F', 'S']]
bit['Normal'] = fz['norm'].cdf(bit.index)
bit['Norm err'] = bit.Normal / bit.F - 1
bit['sGamma'] = fz['sgamma'].cdf(bit.index)
bit['sGamma err'] = bit.sGamma / bit.F - 1
qd(bit, accuracy=4)
Aggregate object: Bahn.4.2b. Frequency distribution poisson. Severity
gamma, [0, inf), exponential right tail. Updated with bucket size 10 and
log2 = 16. Validation: fails sev mean, agg mean.
Mean SD CV Skew P01 Median P99
X
Freq 10 3.1623 0.31623 0.31623
Sev 299.88 1341.7 4.474 8.944 0 0 6530
Agg 2998.8 4347.4 1.4497 2.8293 0 1290 20340
p F S Normal Norm err sGamma sGamma err
loss
0.0 0.061167 0.061167 0.93883 0.24516 3.008 0.12372 1.0227
500.0 0.0028183 0.34051 0.65949 0.28272 -0.16972 0.33463 -0.017272
2000.0 0.0011075 0.59287 0.40713 0.40914 -0.3099 0.58876 -0.0069326
4000.0 0.00057291 0.75165 0.24835 0.59107 -0.21364 0.75046 -0.001581
6000.0 0.00034106 0.84035 0.15965 0.75501 -0.10156 0.84024 -0.00013316
8000.0 0.00021479 0.89473 0.10527 0.87501 -0.022042 0.89494 0.00024274
10000.0 0.00013943 0.9295 0.070498 0.94635 0.018122 0.92977 0.00028566
12000.0 9.225e-05 0.95229 0.047706 0.9808 0.029929 0.95251 0.00023149
14000.0 6.1831e-05 0.96747 0.032529 0.99431 0.027737 0.96763 0.00016081
16000.0 4.1834e-05 0.97769 0.02231 0.99861 0.021395 0.97779 9.9642e-05
18000.0 2.8507e-05 0.98463 0.015371 0.99972 0.015327 0.98468 5.4005e-054 Poisson-Discrete Distribution, Example 4.4
The claim-count random variable is Poisson distributed with mean 1.75. Severity has a discrete distribution with outcomes 1, 2, 3, 4, 5 occurring with probabilities 0.2, 0.4, 0.2, 0.15, 0.05 respectively. Compute the aggregate distribution.
Here is Table 4.5.
a = build('agg Bahn.4.4 1.75 claims '
          'dsev [1 2 3 4 5] [.2 .4 .2 .15 .05] '
          'poisson')
qd(a)
qd(a.density_df.query('p > .001')[['p', 'F', 'S']], accuracy=4)
Aggregate object: Bahn.4.4. Frequency distribution poisson. Severity
dhistogram, [1, 5], bounded; atoms [1 2 3 4 5]. Updated with bucket size
1 and log2 = 6. Validation: not unreasonable.
Mean SD CV Skew P01 Median P99
X
Freq 1.75 1.3229 0.75593 0.75593
Sev 2.45 1.1169 0.45588 0.55603 1 2 5
Agg 4.2875 3.562 0.83078 0.95453 0 4 15
p F S
loss
0.0 0.17377 0.17377 0.82623
1.0 0.060821 0.23459 0.76541
2.0 0.13229 0.36688 0.63312
3.0 0.10464 0.47152 0.52848
4.0 0.11704 0.58855 0.41145
5.0 0.093249 0.6818 0.3182
6.0 0.078644 0.76045 0.23955
7.0 0.064101 0.82455 0.17545
8.0 0.049889 0.87444 0.12556
9.0 0.037655 0.91209 0.087908
10.0 0.02737 0.93946 0.060537
11.0 0.019672 0.95913 0.040865
12.0 0.013764 0.9729 0.027101
13.0 0.0094201 0.98232 0.017681
14.0 0.0063168 0.98864 0.011364
15.0 0.0041654 0.9928 0.0071986
16.0 0.0027032 0.9955 0.0044954
17.0 0.0017249 0.99723 0.0027705
18.0 0.0010842 0.99831 0.00168635 Poisson-Gamma Distribution, Example 4.5
Aggregate losses have Poisson frequency with mean 2.5 and gamma severity with shape 3 and scale 400. Hence the aggregate mean equals 1,200 and variance equals 480,000. Now approximate the distribution function using FFT with a fine bucket size and the midpoint method for assigning claim-size probabilities and then bs=20 and bs=100.
Here is Table 4.6, comparing the distributions. The update method re-runs the FFT computation with different options, here altering bs.
import numpy as np
import pandas as pd
a = build('agg Bahn.4.5 2.5 claims '
          'sev 400 * gamma 3 poisson')
qd(a)
xs = sorted(np.hstack((500, np.arange(0, 10001, 1000))))
bit = a.density_df.loc[xs, ['F']]
a.update(bs=100)
bit100 = a.density_df.loc[xs,  ['F']]
a.update(bs=20)
bit20 = a.density_df.loc[xs,  ['F']]
bit = pd.concat((bit, bit100, bit20), axis=1, keys=['h0.25', 'h100', 'h20'])
bit[('h100', 'Rel Error')] = bit[('h100', 'F')] / bit[('h0.25', 'F')] - 1
bit[('h20', 'Rel Error')] = bit[('h20', 'F')] / bit[('h0.25', 'F')] - 1
bit = bit.sort_index(axis=1)
qd(bit, accuracy=4)
Aggregate object: Bahn.4.5. Frequency distribution poisson. Severity
gamma, [0, inf), exponential right tail. Updated with bucket size 1 and
log2 = 16. Validation: not unreasonable.
Mean SD CV Skew P01 Median P99
X
Freq 2.5 1.5811 0.63246 0.63246
Sev 1200 692.82 0.57735 1.1547 174 1070 3362
Agg 3000 2190.9 0.7303 0.91287 0 2657 9435
h0.25 h100 h20
F F Rel Error F Rel Error
loss
0.0 0.082085 0.082146 0.00074147 0.082086 6.3888e-06
500.0 0.10961 0.11579 0.056419 0.11076 0.010459
1000.0 0.18681 0.19565 0.047279 0.18849 0.0089807
2000.0 0.37563 0.38525 0.025617 0.37747 0.0048979
3000.0 0.56136 0.56991 0.015216 0.56301 0.0029267
4000.0 0.71522 0.72175 0.0091319 0.71648 0.0017661
5000.0 0.82733 0.8318 0.0054039 0.8282 0.0010505
6000.0 0.90137 0.90417 0.0031115 0.90192 0.00060788
7000.0 0.94654 0.94818 0.0017304 0.94686 0.00033969
8000.0 0.97234 0.97324 0.00092617 0.97252 0.00018266
9000.0 0.98628 0.98675 0.00047663 0.98637 9.4437e-05
10000.0 0.99344 0.99367 0.00023603 0.99349 4.6979e-056 Poisson-Lognormal Distribution With Limit, Example 4.15
Consider an aggregate distribution with mean 3 Poisson frequency and lognormal claim size with parameters \((\mu, \sigma) = (6, 1.5)\). Moreover, claim size is limited by a policy limit of 1,000. Graph the aggregate distribution.
The log density (left) shows the probability masses at outcomes consisting of only limit losses. The distribution (right) shows the corresponding jumps. Compare with Figure 4.4.
a = build('agg Bahn.4.15 '
          '3 claims '
          '1000 xs 0 '
          'sev exp(6) * lognorm 1.5 '
          'poisson')
qd(a)

fig, axs = plt.subplots(1, 2, figsize=(2*3.5, 2.45), constrained_layout=True)
ax0, ax1 = axs.flat
a.density_df.p.plot(ax=ax0, logy=True, label='FFT');
a.density_df.F.plot(ax=ax1, label='FFT');
ax0.set(ylabel='log density');
ax0.set(ylabel='distribution', ylim=[0,1]);
ax1.axvline(1000, c='C7', lw=.5);
ax1.axvline(2000, c='C7', lw=.5);
ax1.axvline(3000, c='C7', lw=.5);
Aggregate object: Bahn.4.15. Frequency distribution poisson. Severity
lognorm, [0, 1,000], bounded; 1,000 xs 0. Updated with bucket size 1/4
and log2 = 16. Validation: not unreasonable.
Mean SD CV Skew P01 Median P99
X
Freq 3 1.7321 0.57735 0.57735
Sev 502.97 375.98 0.74753 0.23542 12.25 403.5 1000
Agg 1508.9 1087.7 0.72083 0.82314 0 1327.8 4626.8C:\Users\steve\AppData\Local\Temp\ipykernel_17404\2899995292.py:13: UserWarning: Attempt to set non-positive ylim on a log-scaled axis will be ignored.
ax0.set(ylabel='distribution', ylim=[0,1]);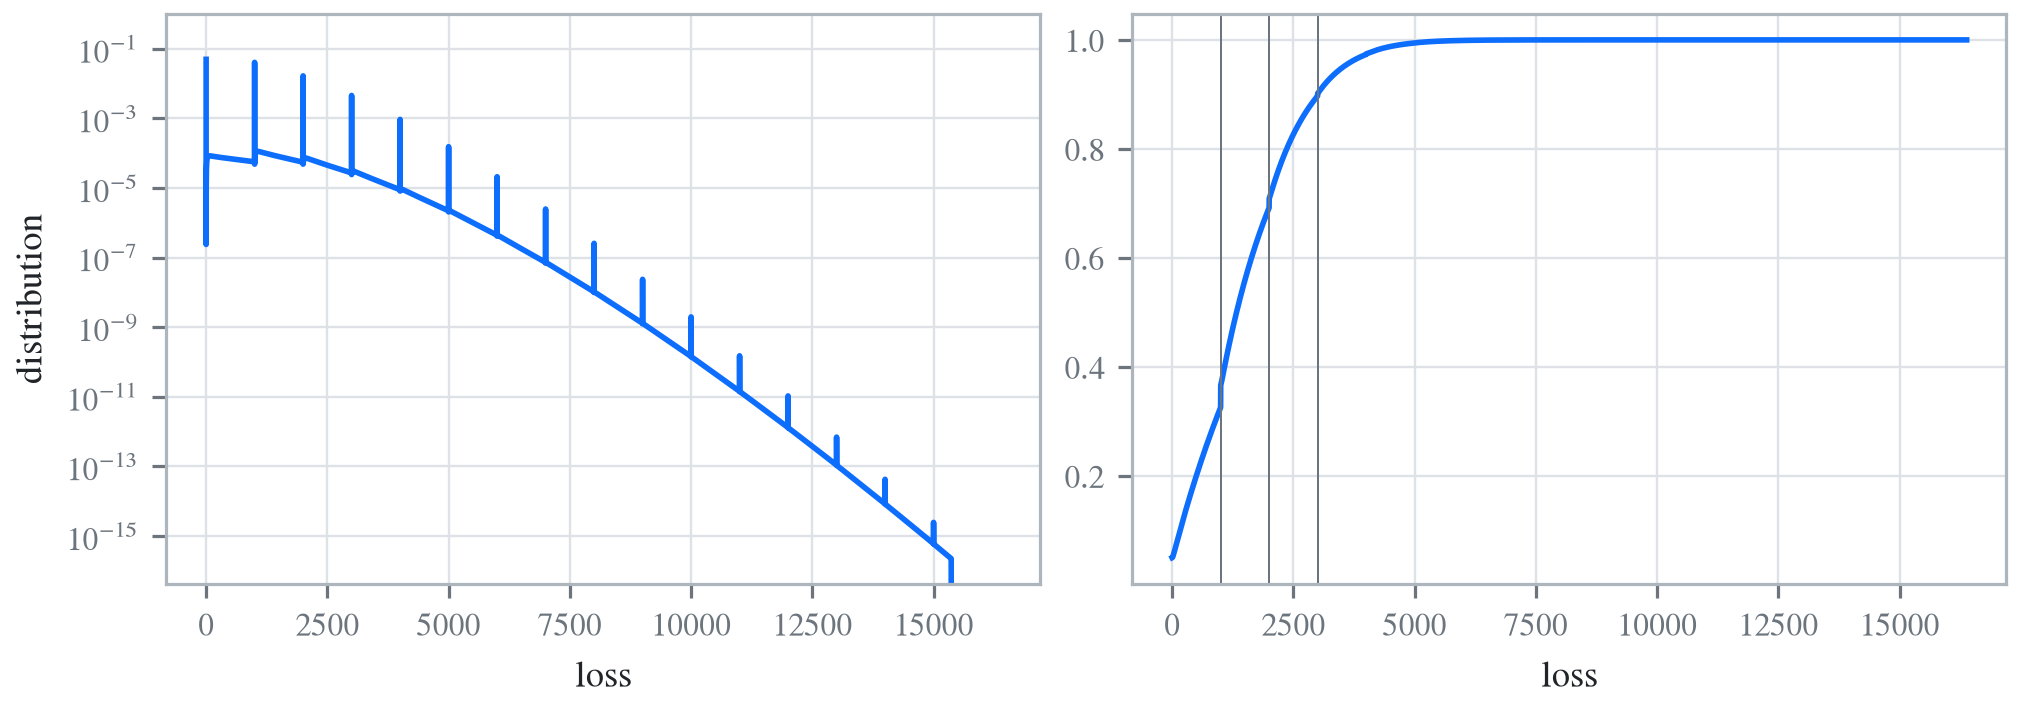
7 Poisson-Gamma Distribution and Approximations, Problems 4.7 and 13
An aggregate distribution has mean 8 Poisson frequency and gamma severity with shape 0.2 and scale 3750. Compute the distribution and compare with normal and shifted-gamma approximations.
a = build('agg Bahn.4.7 '
      '8 claims '
      'sev 3750 * gamma 0.2 '
      'poisson')
qd(a)
xs = np.arange(0, 30000,3000)
qd(a.density_df.loc[xs, ['p', 'F','S']], accuracy=4)
Aggregate object: Bahn.4.7. Frequency distribution poisson. Severity
gamma, [0, inf), exponential right tail. Updated with bucket size 4 and
log2 = 16. Validation: not unreasonable.
Mean SD CV Skew P01 Median P99
X
Freq 8 2.8284 0.35355 0.35355
Sev 749.95 1677.1 2.2362 4.472 0 76 8260
Agg 5999.6 5196.2 0.86608 1.5877 48 4648 23552
p F S
loss
0.0 0.0023109 0.0023109 0.99769
3000.0 0.00041852 0.34222 0.65778
6000.0 0.00028642 0.60713 0.39287
9000.0 0.00017445 0.77755 0.22245
12000.0 0.00010003 0.87826 0.12174
15000.0 5.5233e-05 0.93495 0.065048
18000.0 2.9705e-05 0.96587 0.034134
21000.0 1.5667e-05 0.98234 0.017661
24000.0 8.1387e-06 0.99097 0.0090339
27000.0 4.1768e-06 0.99542 0.0045775aggregate readily computes approximations and returns frozen scipy.stats objects.
fz = a.approximate('all')
comp = pd.DataFrame({k: v.cdf(xs) for k, v in fz.items()}, index=xs)
comp['agg'] = a.density_df.loc[xs, 'F',]
comp.loc[:, [f'{k} err' for k in fz.keys()]] = comp.loc[:, fz.keys()].values / comp.loc[:, ['agg']].values - 1
comp = comp.sort_index(axis=1)
qd(comp, accuracy=4)
            agg   gamma   gamma err  lognorm  lognorm err    norm  norm err   sgamma  sgamma err  \
0     0.0023109       0          -1        0           -1 0.12412    52.712 0.026323      10.391
3000    0.34222  0.3398  -0.0070686  0.29034     -0.15158 0.28188  -0.17632  0.33627   -0.017387
6000    0.60713 0.61488    0.012756  0.64585     0.063778 0.50003   -0.1764  0.60544  -0.0027872
9000    0.77755 0.78364   0.0078297   0.8202     0.054849 0.71817 -0.076365  0.77825  0.00090158
12000   0.87826 0.88085   0.0029516  0.90331      0.02853 0.87591 -0.002674  0.87926   0.0011442
15000   0.93495  0.9352   0.0002659  0.94508     0.010837 0.95837  0.025052   0.9356  0.00068859
18000   0.96587 0.96506 -0.00083072  0.96731    0.0014959 0.98954  0.024513  0.96614  0.00028188
21000   0.98234 0.98128  -0.0010749  0.97975   -0.0026307 0.99805  0.015998  0.98239   4.773e-05
24000   0.99097 0.99002 -0.00095325  0.98703   -0.0039689 0.99973 0.0088479  0.99091 -5.3322e-05
27000   0.99542  0.9947 -0.00072519  0.99145   -0.0039887 0.99997 0.0045718  0.99534 -7.9709e-05

       slognorm  slognorm err
0      0.058639        24.375
3000    0.31391     -0.082718
6000    0.59174     -0.025344
9000    0.77907     0.0019498
12000   0.88466     0.0072901
15000   0.94022      0.005635
18000   0.96881     0.0030474
21000    0.9835     0.0011869
24000   0.99113     0.0001663
27000   0.99515   -0.00027821
8 Poisson-Lognormal Layer Statistics, Example 5.13
Consider an aggregate distribution with mean 15 Poisson frequency and lognormal claim size with parameters \((\mu, \sigma) = (5.9809, 1.8)\). What are the distribution characteristics for random variable S for claims in the layer 5,000 excess of 3,000?
The exact and FFT-estimated mean, cv, and skewness are reported in the summary_df dataframe, for frequency and severity. The values reported agree with the text, up to rounding.
a = build('agg Bahn.5.13 '
      '15 claims 5000 xs 3000 '
      'sev exp(5.9809) * lognorm 1.8 ! '
      'poisson')
qd(a)
mv(a)
Aggregate object: Bahn.5.13. Frequency distribution poisson. Severity
lognorm, [0, 5,000], bounded; 5,000 xs 3,000. Updated with bucket size 2
and log2 = 16. Validation: not unreasonable.
Mean SD CV Skew P01 Median P99
X
Freq 15 3.873 0.2582 0.2582
Sev 385.68 1207.9 3.1319 3.1942 0 0 5000
Agg 5785.3 4910.9 0.84887 0.93405 0 5000 20028
mean = 5785.25
variance = 2.411727e+07
std dev = 4910.93The exact severity can be accessed directly, as a.sevs[0].fz, allowing us to compute the expected layer claim count. The aggregate can then be written in conditional form, producing the same statistics. The distribution function shows probability masses at multiples of the limit.
xs = 15 * a.sevs[0].fz.sf(3000)
print(f'excess claim count = {xs:.5f}')

a = build('agg Bahn.5.13b '
          f'{xs} claims 5000 xs 3000 '
          'sev exp(5.9809) * lognorm 1.8 '
          'poisson')
qd(a)
fig, ax = plt.subplots(1,1,figsize=(3.5, 2.45))
a.density_df.F.plot(ax=ax, label='FFT');
fz = a.approximate('gamma')
ax.plot(a.density_df.loss, fz.cdf(a.density_df.loss), c='C1', label='gamma approx.');
ax.axvline(5000,  c='C7', lw=.5);
ax.axvline(10000, c='C7', lw=.5);
ax.axvline(15000, c='C7', lw=.5);
ax.set(ylabel='cdf');
ax.legend(loc='lower right');
excess claim count = 1.95359
Aggregate object: Bahn.5.13b. Frequency distribution poisson. Severity
lognorm, [0, 5,000], bounded; 5,000 xs 3,000. Updated with bucket size 1
and log2 = 16. Validation: not unreasonable.
Mean SD CV Skew P01 Median P99
X
Freq 1.9536 1.3977 0.71546 0.71546
Sev 2961.3 1890.9 0.63853 -0.16374 34 3030 5000
Agg 5785.3 4910.9 0.84887 0.93405 0 5000 20029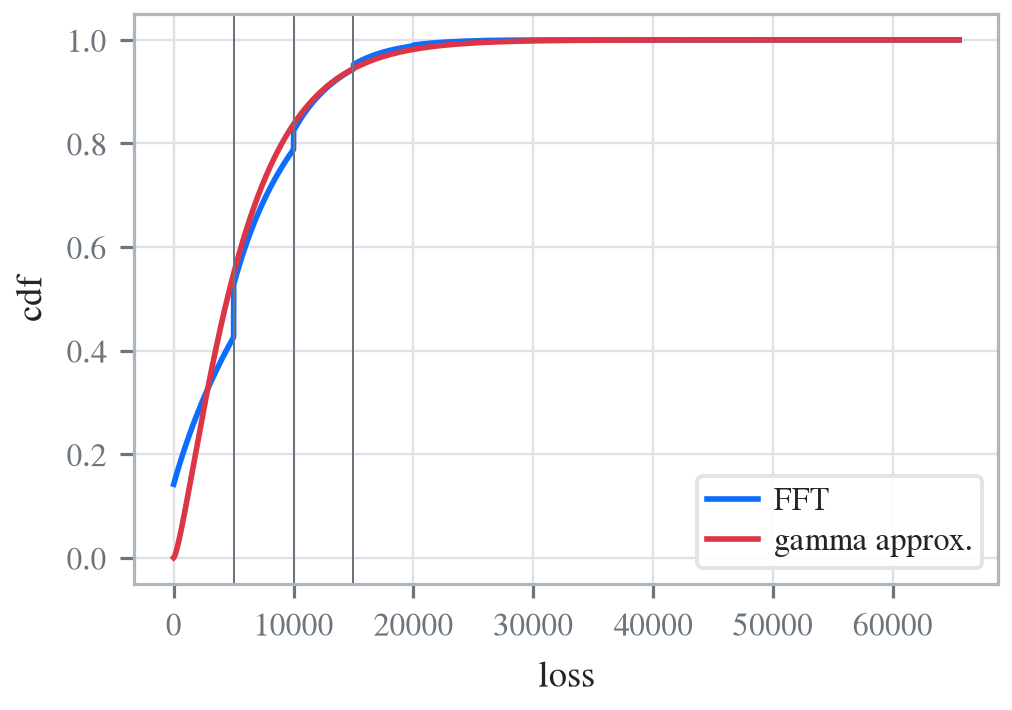
9 Lognormal Increased Limits Factors (ILFs), Example 6.3
Indemnity losses for a portfolio of insurance policies have a lognormal claim-size distribution with parameters \((\mu, \sigma) = (7, 2.4)\). The policy per-claim limit applies only to the indemnity portion of a claim, and the average per-claim loss adjustment expense is 2,200. Claim frequency for these policies is 0.0005 per exposure unit, and variable expenses equal 35% of premium.
A lognormal with \(\sigma = 2.4\) has cv \(\sqrt{\exp(2.4^2)-1}=17.78\) and is extremely thick-tailed, despite having moments of all orders. It is challenging to approximate numerically. Luckily, we only need to compute up to 5M. The aggregate parameters deliberately select a range that is too narrow for the entire distribution, but adequate for our purposes. Use log2=17 and select bs greater than 5e6 // 2**17 = 38. We use bs=50. It is important to set normalize=False to avoid rescaling bucket probabilities to sum to one. These parameters are not a good model for the entire distribution; the mean error is too high.
The density_df dataframe includes limited expected values. Here is a sample.
a = build('agg Bahn.6.3 '
          '1 claim '
          'sev exp(7) * lognorm 2.4 '
          'fixed',
          bs=50, log2=17,
          normalize=False,
         )
qd(a)
xs = [1e5,  5e5, 7.5e5, 1e6, 2e6, 3e6, 4e6, 5e6]
qd(a.density_df.loc[xs, ['F', 'S', 'lev']], accuracy=4)
Aggregate object: Bahn.6.3. Frequency distribution fixed. Severity
lognorm, [0, inf), subexponential right tail. Updated with bucket size
50 and log2 = 17. Validation: grid infeasible for this severity; fails
pmf deficit 1.455e-04, sev mean, agg mean.
Mean SD CV Skew P01 Median P99
X
Freq 1 0 0
Sev 18328 1.4284e+05 7.7935 27.885 0 1100 2.9165e+05
Agg 18328 1.4284e+05 7.7935 27.885 0 1100 2.9165e+05
F S lev
loss
100000.0 0.96998 0.030021 8895.8
500000.0 0.99463 0.0053706 13625
750000.0 0.99674 0.0032647 14668
1000000.0 0.99774 0.002257 15345
2000000.0 0.99912 0.00087817 16738
3000000.0 0.99951 0.00048765 17390
4000000.0 0.99968 0.00031609 17782
5000000.0 0.99978 0.00022372 18048V:\worktrees\aggregate_REFACTOR\src\aggregate\_bucket_window.py:1430: InfeasibleGridWarning: Bahn.6.3: severity 'lognorm' cannot be reproduced on this grid. The body needs bs <= 61.2967 (0.003512% of the mean is supplied below the first half bucket, and is placed at 0); the mean is not complete until the grid reaches 3,951,734,870, so matching it to 0.0001 needs log2 = 26, and log2 = 17 was used. A thick unlimited severity has this problem at any bucket size, because its mean is furnished far above its median and a finer bs only shortens the reach. Add an occurrence limit, or accept the reported moment errors. Further occurrences this session are suppressed; each object records its own verdict in validation.
warn_infeasible_grid(agg)The following reproduces Table 6.1. The ILF factors assume fixed (middle) and variable ALAE (right).
alae = 2200
bit = a.density_df.loc[xs, ['lev']]
bit['Fixed ALAE'] = (bit.lev + alae) / (bit.lev.iloc[0] + alae)
bit['Prop ALAE'] = bit.lev / bit.lev.iloc[0]
qd(bit, accuracy=4)
             lev  Fixed ALAE  Prop ALAE
loss
100000.0  8895.8           1          1
500000.0   13625      1.4262     1.5317
750000.0   14668      1.5202     1.6488
1000000.0  15345      1.5812      1.725
2000000.0  16738      1.7067     1.8815
3000000.0  17390      1.7655     1.9549
4000000.0  17782      1.8009     1.9989
5000000.0  18048      1.8248     2.0288
10 Layer Premium, Example 6.4
(Continues Example 6.3.) Calculate the premium for successive excess layers of insurance for a policy with exposure equal 400. Use the ILFs under the assumption that the average per-claim ALAE payment is 2,200. Premium amounts for the successive million-dollar layers obtained from these layer factors applied to the basic-limit premium are displayed in Table 6.2 and reproduced below.
exposure = 400
var_exp = 0.35
frequency = 0.0005
bit['Premium'] = exposure * frequency * (bit['lev'] + alae) / (1 - var_exp)
bit['Layer Premium'] = np.diff(bit.Premium, prepend=0)
qd(bit)
             lev  Fixed ALAE  Prop ALAE  Premium  Layer Premium
loss
100000.0  8895.8           1          1   3414.1         3414.1
500000.0   13625      1.4262     1.5317   4869.3         1455.2
750000.0   14668      1.5202     1.6488   5190.1         320.73
1000000.0  15345      1.5812      1.725   5398.4         208.38
2000000.0  16738      1.7067     1.8815     5827         428.52
3000000.0  17390      1.7655     1.9549   6027.7         200.71
4000000.0  17782      1.8009     1.9989   6148.3         120.63
5000000.0  18048      1.8248     2.0288   6230.1          81.76
11 Risk Loads, Example 6.5
Example 6.5, computes risk loads as a percentage of standard deviation. aggregate can compute multiple limits at once, and the report_df dataframe returns individual severity and aggregate distribution statistics. The risk loads can be deduced from these. The risk load can be computed as k' * ex2 or k * actual_cv (not shown).
The following code reproduces Table 6.3. First, define the controlling variables, and then set up the tower of limits within one object, using Vectorization: Limit Profiles and Mixed Severity.
k_prime = 0.0277
m = 400
ϕ = 0.0005
u = 0.2
k = k_prime / np.sqrt(m * ϕ)

limits = [1e5, 5e5, 1e6, 2e6, 3e6, 4e6, 5e6]
bl = build('agg Bahn.6.5 '
           f'{m * ϕ} claims '
           f'{limits} xs 0 '
           'sev exp(7) * lognorm 2.4 '
           'poisson'
           , bs=50, log2=18)
qd(bl.stats_df.iloc[:, :len(limits)], accuracy=4)
                           e0.m0      e1.m0      e2.m0      e3.m0      e4.m0      e5.m0      e6.m0
component measure
meta      limit            1e+05      5e+05      1e+06      2e+06      3e+06      4e+06      5e+06
          attachment           0          0          0          0          0          0          0
          el              1779.2     2725.1       3069     3347.6       3478     3556.5     3609.6
          prem                 0          0          0          0          0          0          0
          lr                   0          0          0          0          0          0          0
          sevcv_param          0          0          0          0          0          0          0
          mix_cv               0          0          0          0          0          0          0
          wt             0.14286    0.14286    0.14286    0.14286    0.14286    0.14286    0.14286
freq      ex1                0.2        0.2        0.2        0.2        0.2        0.2        0.2
          ex2               0.24       0.24       0.24       0.24       0.24       0.24       0.24
          ex3              0.328      0.328      0.328      0.328      0.328      0.328      0.328
          mean               0.2        0.2        0.2        0.2        0.2        0.2        0.2
...                          ...        ...        ...        ...        ...        ...        ...
sev       ex1               8896      13626      15345      16738      17390      17782      18048
          ex2         5.1251e+08 2.8271e+09 5.2833e+09 9.2441e+09 1.2442e+10 1.5158e+10 1.7534e+10
          ex3         4.2417e+13 1.0687e+15 3.8053e+15 1.2593e+16 2.4512e+16 3.8722e+16 5.4725e+16
          mean              8896      13626      15345      16738      17390      17782      18048
          cv              2.3401     3.7719       4.63     5.6565     6.3357      6.851     7.2685
          skew            3.3416     7.0585     9.9524     14.303     17.849     20.975     23.827
agg       ex1             1779.2     2725.1       3069     3347.6       3478     3556.5     3609.6
          ex2         1.0567e+08 5.7284e+08 1.0661e+09   1.86e+09 2.5005e+09 3.0442e+09 3.5199e+09
          ex3         9.0362e+12 2.1839e+14 7.7081e+14 2.5373e+15 4.9284e+15 7.7768e+15 1.0983e+16
          mean            1779.2     2725.1       3069     3347.6       3478     3556.5     3609.6
          cv              5.6903     8.7257     10.592     12.844     14.342     15.482     16.406
          skew            8.1747     15.898     22.157     31.683     39.494     46.396     52.704
stats_df carries one column per vectorized limit followed by the whole-object summary columns (mixed, independent, after_occ, empirical and the impact and error columns). Slicing to len(limits) keeps the per-limit components and drops the summary, whatever the summary block happens to contain.
Next, extract the required columns from stats_df and manipulate to compute the ILFs.
bit = bl.stats_df.loc[
    [('sev', 'mean'), ('sev', 'cv'), ('agg', 'mean'), ('agg', 'cv')]
].iloc[:, :len(limits)].T
bit.columns = ['sev_m', 'sev_cv', 'actual_m', 'actual_cv']
bit.index = limits
bit.index.name = 'limit'
bit['vx'] = (bit.sev_m * bit.sev_cv) ** 2
bit['ex2'] = bit.vx + bit.sev_m**2
bit['risk load'] = k_prime * bit.ex2 ** 0.5
bit['lev'] = (1+u) * bit.sev_m
bit['ILF w/o risk'] = bit['lev'] / bit.loc[100000, 'lev']
bit['ILF with risk'] = (bit['lev'] + bit['risk load']) / (bit.loc[100000, 'lev'] + bit.loc[100000, 'risk load'])
qd(bit, accuracy=4)
           sev_m  sev_cv  actual_m  actual_cv         vx        ex2  risk load   lev  \
limit
100000.0    8896  2.3401    1779.2     5.6903 4.3337e+08 5.1251e+08     627.09 10675
500000.0   13626  3.7719    2725.1     8.7257 2.6414e+09 2.8271e+09     1472.8 16351
1000000.0  15345    4.63      3069     10.592 5.0478e+09 5.2833e+09     2013.4 18414
2000000.0  16738  5.6565    3347.6     12.844  8.964e+09 9.2441e+09     2663.3 20085
3000000.0  17390  6.3357      3478     14.342 1.2139e+10 1.2442e+10     3089.7 20868
4000000.0  17782   6.851    3556.5     15.482 1.4842e+10 1.5158e+10     3410.4 21339
5000000.0  18048  7.2685    3609.6     16.406 1.7208e+10 1.7534e+10     3667.9 21658

           ILF w/o risk  ILF with risk
limit
100000.0              1              1
500000.0         1.5316          1.577
1000000.0        1.7249         1.8074
2000000.0        1.8815         2.0127
3000000.0        1.9548         2.1197
4000000.0        1.9989         2.1897
5000000.0        2.0288         2.2407
12 Aggregate Premiums, Example 6.6
(Continues Example 6.3.) Compute expected losses across a variety of occurrence and aggregate limit combinations. Assume 20% ALAE outside the limits, expected claim count 1.2 with contagion parameter 0.1 (cv of mixing \(\sqrt{0.1}\)), and lognormal severity \((\mu, \sigma) = (7.6, 2.4)\) (see errata).
The following code calculates Table 6.4 using FFT aggregate distributions. The last column, showing unlimited aggregate losses, agrees, but the other columns are slightly different because Bahnemann uses a shifted gamma approximation.
First, we compute all the aggregates.
b = {}
for per_claim in [0.5e6, 1e6, 2e6, 3e6, 4e6, 5e6]:
    tower = np.array([0]  + [i for i in [0, 1e6, 2e6, 3e6, 4e6, 5e6, np.inf]
            if i >= per_claim])
    b[per_claim] = build('agg Bahn.6.6 1.2 claims '
           f'{per_claim} xs 0 '
           'sev exp(7.6) * lognorm 2.4 '
           f'mixed gamma {0.1}**.5 '
           f'aggregate ceded to tower {tower} '
           , bs=50, log2=18,
           normalize=False,
          )
qd(pd.concat([i.summary_df[['Mean', 'CV', 'Skew']]
              for i in b.values()],
    keys=b.keys(), names=['Occ limit', 'X']),
    accuracy=4)
                Mean      CV   Skew
Occ limit X
500000.0  Freq   1.2 0.96609 1.0696
          Sev  21742  3.1549 5.3107
          Agg  26091  3.0377 4.9943
1000000.0 Freq   1.2 0.96609 1.0696
          Sev  25279  3.8779 7.3846
          Agg  30335  3.6694 6.7822
2000000.0 Freq   1.2 0.96609 1.0696
          Sev  28338   4.758 10.437
          Agg  34006  4.4496 9.4728
3000000.0 Freq   1.2 0.96609 1.0696
          Sev  29850  5.3511 12.892
          Agg  35820  4.9795  11.66
4000000.0 Freq   1.2 0.96609 1.0696
          Sev  30791  5.8075  15.04
          Agg  36949  5.3888 13.582
5000000.0 Freq   1.2 0.96609 1.0696
          Sev  31444  6.1815  16.99
          Agg  37733   5.725 15.332
The tower cedes everything above zero, so the ceded view summary_df reports here is also the subject (gross) view. Where a cession is partial, read the subject statistics off the ('agg', 'subject', 'agg') row of reins_summary_df instead.
Next, determine the layer loss costs. The cumulative ceded loss to an aggregate limit L is the limited expected value \(\mathsf{P}(S \wedge L)\), which equals the whole-structure ceded mean of an aggregate ceded to L xs 0 cover. Read it from reins_summary_df (the ('agg', 'ceded', 'agg') row, column Est EX).
Note
This example previously used the per-layer reinsurance_audit_df dataframe, removed in 1.0.0a19 in favour of the whole-structure reins_summary_df / reins_stats_df / reins_density_df objects. To rebuild the per-agg-limit ILF table, loop over the aggregate breakpoints L and the per-claim occurrence limits, build aggregate ceded to L xs 0 for each, and collect the ceded aggregate mean from reins_summary_df; normalise by the 500000 per-claim, unlimited-aggregate cell for the ILF.
Here is a reconciliation to Table 6.4 of the 2M per claim and 2M aggregate limit expected loss, using the shifted gamma approximation. The limited aggregate loss is computed using the integral of the survival function fz.sf. quad is a general purpose numerical integration routine. It returns the integral and estimated error.
fz = b[2000000].approximate('sgamma')
print(fz.stats())
mv(b[2000000])
from scipy.integrate import quad
quad(fz.sf, 0, 2000000)
(np.float64(34005.90148666896), np.float64(22895161273.613277))
mean = 34006.1
variance = 2.289516e+10
std dev = 151311(33523.06665834545, 0.00040650276002622316)13 Deductible Credits, Example 6.7
(Continues Example 6.3.) Consider a portfolio of policies for which the ground-up indemnity claim size has a lognormal distribution with parameters \((\mu, \sigma) = (7.0, 2.4)\) and allocated loss adjustment expense is 20% of the indemnity amount. The basic limit is 100,000. Calculate the credit factors, as well as the resulting frequency and severity, for six straight deductible options: 1,000; 2,000; 3,000; 4,000; 5,000; and 10,000. Base frequency equals 0.0005.
We can build all of the required distributions simultaneously using vectorization. Remember that the basic limit is ground up. The severity is unconditional, indicated by ! at the end of the severity clause. The limit is eroded by the deductible.
deductibles = [0, 1e3, 2e3, 3e3, 4e3, 5e3, 10e3]
limits = [100000 - i for i in deductibles]
ϕ = 0.0005
alae = 1.2
bl = build('agg Bahn.6.7 '
           f'{ϕ} claims '
           f'{limits} xs {deductibles} '
           'sev exp(7) * lognorm 2.4 ! '
           'poisson'
           , bs=50, log2=18)
qd(bl.stats_df.iloc[:, :len(limits)], accuracy=4)
                           e0.m0      e1.m0      e2.m0      e3.m0      e4.m0      e5.m0      e6.m0
component measure
meta      limit            1e+05      99000      98000      97000      96000      95000      90000
          attachment           0       1000       2000       3000       4000       5000      10000
          el               4.448     4.1183     3.8926     3.7092     3.5517     3.4124     2.8758
          prem                 0          0          0          0          0          0          0
          lr                   0          0          0          0          0          0          0
          sevcv_param          0          0          0          0          0          0          0
          mix_cv               0          0          0          0          0          0          0
          wt             0.14286    0.14286    0.14286    0.14286    0.14286    0.14286    0.14286
freq      ex1             0.0005     0.0005     0.0005     0.0005     0.0005     0.0005     0.0005
          ex2         0.00050025 0.00050025 0.00050025 0.00050025 0.00050025 0.00050025 0.00050025
          ex3         0.00050075 0.00050075 0.00050075 0.00050075 0.00050075 0.00050075 0.00050075
          mean            0.0005     0.0005     0.0005     0.0005     0.0005     0.0005     0.0005
...                          ...        ...        ...        ...        ...        ...        ...
sev       ex1               8896     8236.6     7785.2     7418.4     7103.4     6824.9     5751.7
          ex2         5.1251e+08 4.9544e+08 4.7944e+08 4.6425e+08 4.4973e+08 4.3581e+08 3.7327e+08
          ex3         4.2417e+13 4.0906e+13 3.9443e+13 3.8028e+13 3.6657e+13 3.5329e+13 2.9274e+13
          mean              8896     8236.6     7785.2     7418.4     7103.4     6824.9     5751.7
          cv              2.3401     2.5106     2.6287     2.7269      2.813     2.8907     3.2067
          skew            3.3416     3.3681     3.4054     3.4444     3.4833     3.5215     3.6997
agg       ex1              4.448     4.1183     3.8926     3.7092     3.5517     3.4124     2.8758
          ex2         2.5627e+05 2.4774e+05 2.3973e+05 2.3214e+05 2.2488e+05 2.1792e+05 1.8664e+05
          ex3         2.1212e+10 2.0456e+10 1.9725e+10 1.9017e+10 1.8331e+10 1.7667e+10 1.4639e+10
          mean             4.448     4.1183     3.8926     3.7092     3.5517     3.4124     2.8758
          cv              113.81     120.85     125.78     129.89     133.51     136.79     150.22
          skew            163.49     165.89     168.03     170.02     171.89     173.66     181.54
Next, manipulate the stats_df dataframe to compute the required quantities. The final exhibit replicates Table 6.5.
bit = bl.stats_df.iloc[:, :len(limits)].loc[
    [('meta', 'attachment'), ('freq', 'mean'), ('sev', 'mean'), ('agg', 'mean')]
].T
bit.columns = ['attachment', 'freq_m', 'sev_m', 'actual_m']
bit = bit.rename(columns={'attachment': 'deductible'}).set_index('deductible')
bit['F(d)'] = np.array([bl.sevs[0].fz.cdf(i) for i in bit.index])
bit['freq_m'] = bit.loc[0, 'freq_m'] * (1 - bit['F(d)'])
bit['E[X;d]'] = (bit.sev_m[0] - bit.sev_m)
bit['C(d)'] = bit['E[X;d]'] / bit.sev_m[0]
bit['sev_m'] = bit['sev_m'] / (1 - bit['F(d)']) * alae
bit = bit.iloc[:, [-2, 3, -1, 0, 1]]
bit['pure prem'] = bit.freq_m * bit.sev_m
qd(bit, accuracy=4)
            E[X;d]    F(d)     C(d)     freq_m  sev_m  pure prem
deductible
0.0              0       0        0     0.0005  10675     5.3376
1000.0      659.42 0.48467 0.074125 0.00025766  19180      4.942
2000.0      1110.8 0.59885  0.12487 0.00020057  23289     4.6711
3000.0      1477.7 0.66251  0.16611 0.00016875  26377      4.451
4000.0      1792.7 0.70512  0.20151 0.00014744  28907      4.262
5000.0      2071.2 0.73636  0.23282 0.00013182  31064     4.0949
10000.0     3144.4 0.82147  0.35346 8.9266e-05  38660      3.451
14 Summary
Here is a summary of all the objects created in this section.
from aggregate import format_program
for n, r in build.discover('^Bahn').iterrows():
    print(format_program(r.program))
agg Bahn.4.1
dfreq [0 1 2] [0.6 0.3 0.1]
dsev [1 2 3] [0.4 0.5 0.1]
agg Bahn.4.15
3 claims
1000 xs 0
sev 403.4287934927351 * lognorm 1.5
poisson
agg Bahn.4.2
2.5 claims
sev 400 * gamma 3
poisson
agg Bahn.4.2b
10 claims
sev 6000 * gamma 0.05
poisson
agg Bahn.4.4
1.75 claims
dsev [1 2 3 4 5] [0.2 0.4 0.2 0.15 0.05]
poisson
agg Bahn.4.5
2.5 claims
sev 400 * gamma 3
poisson
agg Bahn.4.7
8 claims
sev 3750 * gamma 0.2
poisson
agg Bahn.5.13
15 claims
5000 xs 3000
sev 395.7964246880697 * lognorm 1.8 !
poisson
agg Bahn.5.13b
1.9535923221305609 claims
5000 xs 3000
sev 395.7964246880697 * lognorm 1.8
poisson
agg Bahn.6.3
1 claim
sev 1096.6331584284585 * lognorm 2.4
fixed
agg Bahn.6.5
0.2 claims
[100000 500000 1000000 2000000 3000000 4000000 5000000] xs 0
sev 1096.6331584284585 * lognorm 2.4
poisson
agg Bahn.6.6
1.2 claims
5000000 xs 0
sev 1998.1958951041172 * lognorm 2.4
mixed gamma 0.31622776601683794
aggregate ceded to
5000000 xs 0 and
inf xs 5000000
agg Bahn.6.7
0.0005 claims
[100000 99000 98000 97000 96000 95000 90000] xs [0 1000 2000 3000 4000 5000 10000]
sev 1096.6331584284585 * lognorm 2.4 !
poissonPrograms in the aggregate Loss Lab
Each program below opens in the aggregate Loss Lab, which builds it with nothing to install. The names are those in recitations.agg, where every program is renamed by its text’s citation key, or by Exam for an examination question.
Bahnemann2015.Bahn.4.1: Example 4.1, a simple discrete aggregate.Bahnemann2015.Bahn.4.2: Example 4.2, a Poisson gamma (Tweedie) aggregate.Bahnemann2015.Bahn.4.2b: Example 4.3, the Tweedie at a higher frequency, for the approximations.Bahnemann2015.Bahn.4.4: Example 4.4, a Poisson discrete aggregate.Bahnemann2015.Bahn.4.5: Example 4.5, a Poisson gamma aggregate.Bahnemann2015.Bahn.4.15: Example 4.15, a Poisson lognormal aggregate with a limit of 1,000.Bahnemann2015.Bahn.4.7: Problems 4.7 and 4.13, a Poisson gamma aggregate and its approximations.Bahnemann2015.Bahn.5.13: Example 5.13, the layer 5,000 xs 3,000 of a Poisson lognormal, per loss.Bahnemann2015.Bahn.5.13b: Example 5.13, the same layer with the count of claims reaching it.Bahnemann2015.Bahn.6.3: Example 6.3, the lognormal severity behind the increased limits factors.Bahnemann2015.Bahn.6.5: Example 6.5, risk loads at seven policy limits.Bahnemann2015.Bahn.6.6: Example 6.6, aggregate premiums at a per claim limit of 500,000.Bahnemann2015.Bahn.6.6.v2: Example 6.6, aggregate premiums at a per claim limit of 1,000,000.Bahnemann2015.Bahn.6.6.v3: Example 6.6, aggregate premiums at a per claim limit of 2,000,000.Bahnemann2015.Bahn.6.6.v4: Example 6.6, aggregate premiums at a per claim limit of 3,000,000.Bahnemann2015.Bahn.6.6.v5: Example 6.6, aggregate premiums at a per claim limit of 4,000,000.Bahnemann2015.Bahn.6.6.v6: Example 6.6, aggregate premiums at a per claim limit of 5,000,000.Bahnemann2015.Bahn.6.7: Example 6.7, deductible credits at seven deductibles.
Bahnemann, D. (2015). Distributions for Actuaries. Casualty Actuarial Society Monographs No. 2. www.casact.org