---
title: Using loss corridors
subtitle: "Loss ratio corridors retained by the cedant on an aggregate quota share with the DecL corridor clause"
categories: [reinsurance, variable feature, P&L]
date: last-modified
jupyter:
jupytext:
text_representation:
extension: .qmd
format_name: quarto
format_version: '1.0'
kernelspec:
display_name: Python 3 (ipykernel)
language: python
name: python3
---
A **loss corridor** is a band of loss ratio in which the cedant takes back part of the ceded loss. The reinsurer pays in full below the band and only in part inside it, and above the band it pays in full again, short by the amount the cedant retained. Corridors appear on quota shares, often of new or volatile business, and on some excess of loss treaties, usually with the band at or above the expected loss ratio. With ceded loss $A$, a fixed ceded premium $P_C$ and ceded loss ratio $\lambda = A/P_C$, the cedant retains a share $s$ of a band of width $w$ above an attachment $a$, and the ceded loss ratio after the corridor is
$$
\lambda' = \lambda - s\min((\lambda - a)^+, w),
$$
with recovery $A' = \lambda' P_C$. The retained amount is $s$ times a layer of the loss ratio, $w$ excess of $a$, and is at most $swP_C$.
In DecL the clause `corridor <share> po <width> xs <attach>` decorates one layer of an `aggregate net of` program, with the band written in loss ratio terms and the layer words `po` and `xs`. The layer needs a `deposit`, `rol`, or `rate` premium to form the loss ratio, and it may take a flat commission `cede` beside the corridor. The corridor is one of the variable features of DecL, with [sliding scale commissions](sliding-scale.qmd), [profit commissions](profit-commission.qmd), [swing rating](swing-rating.qmd), and [retro rating](retro-rating.qmd). A program takes at most one of them, the reinsurance features decorate aggregate covers only, and all take effect in a `pnl` or `xpnl` (see [Using pnl and xpnl](pnls.qmd)). The corridor changes the recovery, booked in the loss column `L` of `economic_ratios_df`.
```decl
aggregate net of 50% po inf xs 0 rate 100% cede 0.25 corridor 0.5 po 0.2 xs 0.6 as QS
aggregate net of 50% po inf xs 0 rate 100% cede 0.25 corridor 100% po 10% xs 75% as QS
aggregate net of 2000 xs 8000 rate 6% corridor 0.5 po 0.5 xs 1 as "Stop loss"
```
The variable feature pages share one base book: premium 10,000 at a 70% loss ratio, a policy limit of 2,000, lognormal severity with mean 150 and CV 2.5, gamma mixed claim counts with mixing CV 0.25, and expenses of 25% of premium. The setup cell wraps the book in an `xpnl` with a slot for each reinsurance program.
```{python}
import numpy as np
import pandas as pd
from aggregate import build, qd, __version__
from style import wprint, GT, refuse, figures, figure
figures()
print(__version__)
book = '''agg Book
  10000 premium at 0.7 lr
  2000 xs 0
  sev lognorm 150 cv 2.5 {occurrence}
  mixed gamma 0.25 {aggregate}'''
program = '''xpnl {name}
  inherit premium
  less
    ''' + book + '''
  less
    0.25 premium expenses'''
def quota_share(name, terms):
    """The base book under a 50% quota share at a 100% rate with the given terms."""
    return build(program.format(name=name, occurrence='',
                 aggregate=f'aggregate net of 50% po inf xs 0 rate 100% {terms} as QS'))
```
## A loss corridor on a 50% quota share
The cover is a 50% quota share of the base book at 100% of the subject premium with a flat 25% commission, so the ceded premium is 5,000 and the ceded loss ratio equals the gross loss ratio, with mean 70%. The cedant retains half the ceded loss in the band of loss ratio from 60% to 80%, at most $0.5 \times 0.2 \times 5{,}000 = 500$. The comparison is the same quota share and commission with no corridor.
```{python}
plain = quota_share('Plain', 'cede 0.25')
corridor = quota_share('Corridor', 'cede 0.25 corridor 0.5 po 0.2 xs 0.6')
print(corridor.engine.variable_terms)
qd(corridor)
```
The `QS` step is the cover from the cedant's side: the ceded premium of 5,000 against the recovery and the commission of 1,250, which together make the obligation row, with mean 4,521. The ledger `economic_df` lists the recovery after the corridor, with mean 3,271 against the 3,500 of the plain quota share, so the cedant retains 229 on average. In the 1 in 100 bad year, column `κ01`, the cedant retains the whole 500 and the recovery is 6,786.
```{python}
GT(corridor.economic_df.loc['QS', ['EX', 'SD', 'κ01', 'κ50', 'κ99']], float_format=',.0f')
```
## Ceded loss ratio and net result against the plain quota share
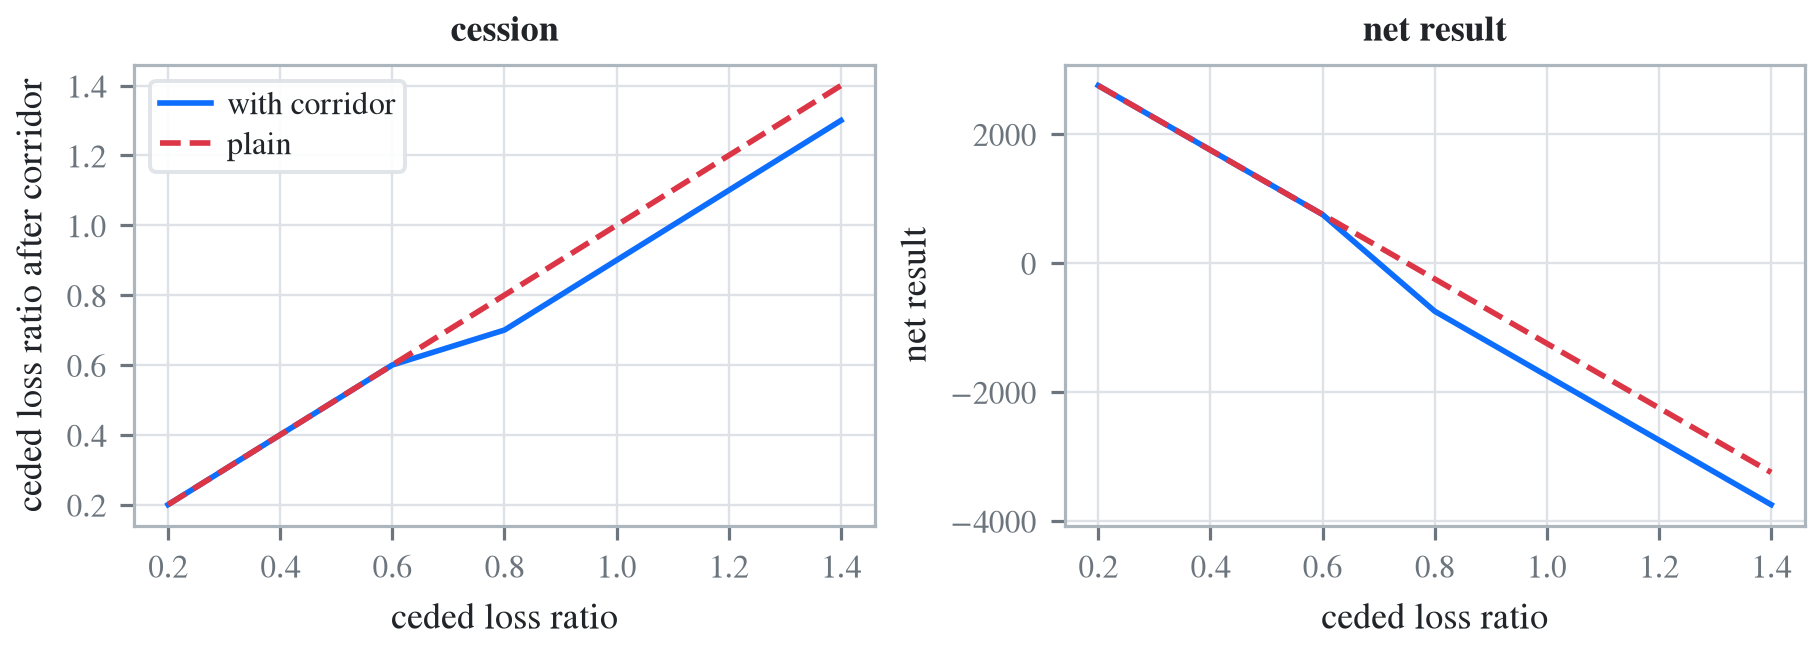
The ceded loss ratio after the corridor and the cedant's net result are both functions of the ceded loss ratio $\lambda$. The gross loss is $10{,}000\lambda$, so the net result, premium less expense and ceded premium, plus commission and recovery, less gross loss, is $2{,}500 + 5{,}000(0.25 + \lambda') - 10{,}000\lambda$. The left panel shows the ceded loss ratio with and without the corridor and the right panel the two net results.
```{python}
lr = np.linspace(0.2, 1.4, 241)
ceded = {'with corridor': corridor.engine.variable_terms.phi(lr), 'plain': lr}
fig, (ax0, ax1) = figure('full', cols=2)
for (k, c), ls in zip(ceded.items(), ['-', '--']):
    ax0.plot(lr, c, ls=ls, label=k)
    ax1.plot(lr, 10000 - 2500 - 5000 + 5000 * (0.25 + c) - 10000 * lr, ls=ls, label=k)
ax0.set(xlabel='ceded loss ratio', ylabel='ceded loss ratio after corridor', title='cession')
ax1.set(xlabel='ceded loss ratio', ylabel='net result', title='net result')
ax0.legend();
```
Inside the band the recovery rises half as fast as the loss, so the net result falls at 1.5 times the slope of the plain quota share. Above 80% the two lines are parallel again, the corridor 500 below. The table compares the two covers over the whole distribution, with `P01` the 1 in 100 bad result.
```{python}
df = pd.DataFrame({k: [-x.economic_ratios_df.loc['QS', 'L'], x.est_m, x.est_sd, x.q(0.01), x.cdf(0)]
                   for k, x in {'plain': plain, 'with corridor': corridor}.items()},
                  index=['recovery', 'mean', 'SD', 'P01', 'Pr(loss)']).T
df.index.name = 'cover'
GT(df, float_format=',.0f', ratio_cols=['Pr(loss)'])
```
The corridor costs the cedant 229 of mean result, the expected retained loss, and the full 500 in the 1 in 100 year, where `P01` falls from $-3{,}536$ to $-4{,}036$. The standard deviation (SD) of the net result rises from 1,352 to 1,550 and the probability of a loss, a result of zero or less, from 38.5% to 45.5%.
## A full corridor and a sliding scale
A corridor with share 1 over the band from 60% to 80%, beside a flat 35% commission, gives the cedant the same net result as the sliding scale on [Using sliding scale commissions](sliding-scale.qmd), which pays 35% at a loss ratio of 60% and 15% at 80%. Inside the band both take back one point per point of loss ratio, the corridor through the recovery and the sliding scale through the commission, and outside it the two pay the same total. The ledgers differ, but the net results have the same mean and standard deviation.
```{python}
same = quota_share('Same', 'cede 0.35 corridor 1 po 0.2 xs 0.6')
slide = quota_share('Slide', 'slide 0.35 at 0.6 and 0.25 at 0.7 and 0.15 at 0.8')
for x in [same, slide]:
    print(f'{x.name:6s} mean {x.est_m:.4f} SD {x.est_sd:.4f}')
```