Code
import pandas as pd
from aggregate import build, qd, __version__
from style import wprint, GT, refuse, figures, figure
figures()
print(__version__)1.43.1grossnet, grossceded and netcededJoint distribution of gross, ceded and net loss under occurrence reinsurance with the view-pair prefixes
An aggregate with occurrence reinsurance has three views of the annual loss: gross \(G\), ceded \(C\), and net \(N = G - C\). The agg computes the distribution of each, but the three marginal distributions do not determine how the views move together. The recovery in a bad gross year depends on whether the year is bad because of many small claims or a few large ones. The DecL prefixes netceded, grossceded, and grossnet turn an agg with occurrence reinsurance into a BivariateAggregate of two of its views, \(x\) then \(y\) in the order the keyword lists them: netceded is (net, ceded), grossceded is (gross, ceded), and grossnet is (gross, net).
The joint law is built claim by claim. A gross claim \(x\) cedes \(c(x)\) and retains \(x - c(x)\), so the per-claim pair lies on the graph of the cession function. The pair is compounded with the shared claim count by a two-dimensional FFT, as in Using bivariate. Each marginal reproduces the corresponding view of the agg, and in netceded the total \(x + y\) is the gross loss. The expected recovery given the gross outcome, \(\kappa(g) = \mathsf{P}(C \mid G = g)\), is computed at every gross outcome by exeqa_df, and conditional returns the whole conditional law at one outcome.
The prefix goes in front of an agg program, written in full or as a reference to a stored aggregate. Only the occurrence program is used: annual terms such as aad and agglimit, and economic clauses such as rate and cede, are ignored with a warning, because the joint is of losses against losses. From Python, Aggregate.occ_bivariate(views=('gross', 'ceded')) returns the same object from a built aggregate.
grossceded agg Book 10 claims 1000 xs 0 sev lognorm 50 cv 2 occurrence net of 750 xs 250 poisson
grossnet agg GrossNet agg.Book          # by reference to a stored aggregate
netceded agg NetCeded agg.Bookimport pandas as pd
from aggregate import build, qd, __version__
from style import wprint, GT, refuse, figures, figure
figures()
print(__version__)1.43.1The example book has ten claims a year from a lognormal with mean 50 and coefficient of variation 2, limited to 1,000, and cedes everything above 250 on each occurrence. The agg is built and stored first, with mean gross, ceded, and net losses 492.65, 52.81, and 439.84. Each view pair is then built by reference to it.
a = build('agg Book 10 claims 1000 xs 0 sev lognorm 50 cv 2 '
          'occurrence net of 750 xs 250 poisson')
print(a.reins_stats_df.loc[('agg', 'mean')])
view layer
occ Gross 492.651736
layer.1 52.811908
Ceded 52.811908
Net 439.839828
Name: (agg, mean), dtype: float64The table lists the two axes of each pair, their means, the mean of \(x + y\), and the correlation of \(x\) and \(y\). The marginal means match the agg in every pair. In netceded the total is the gross loss, 492.65, while in the other two pairs the total has no direct meaning. Gross and net are the most closely related pair, with correlation 0.904, and net and ceded the least, with 0.403.
pairs = {kw: build(f'{kw} agg {kw.title()} agg.Book')
         for kw in ['netceded', 'grossceded', 'grossnet']}
df = pd.DataFrame.from_dict(
    {kw: [*b.unit_names, *b.summary_df.Mean, b.corr] for kw, b in pairs.items()},
    orient='index', columns=['x', 'y', 'mean x', 'mean y', 'mean x + y', 'corr'])
df.index.name = 'prefix'
GT(df, float_format=',.2f', formatters={'corr': '{x:.3f}'})| prefix | x | y | mean x | mean y | mean x + y | corr |
|---|---|---|---|---|---|---|
| netceded | Net | Ceded | 439.84 | 52.81 | 492.65 | 0.403 |
| grossceded | Gross | Ceded | 492.65 | 52.81 | 545.46 | 0.753 |
| grossnet | Gross | Net | 492.65 | 439.84 | 932.49 | 0.904 |
The pair grossceded gives the conditional law of the recovery at each gross outcome. The table shows it at four gross outcomes: the median and the 1 in 10, 1 in 100, and 1 in 1,000 years. Over all years the treaty cedes \(52.81/492.65 = 10.7\%\) of gross loss, but the share is far from constant. In a median year, 424, the expected recovery is 3.7 and 92% of such years recover nothing. In the 1 in 10 year, 904, the expected recovery is 153, or 16.9% of gross, yet 19% of those years recover nothing, and the 1st to 99th percentile range runs from 0 to 528. In the 1 in 100 year, 1,544, the share is 39.8%, and nearly every such year recovers something.
gc = pairs['grossceded']
gross = gc.marginal('Gross')
rows = {}
for year, p in {'median': 0.5, '1 in 10': 0.9, '1 in 100': 0.99,
                '1 in 1,000': 0.999}.items():
    g = gross.q(p)
    c = gc.conditional('x', g)
    rows[year] = [g, c.mean(), c.mean() / g, c.cdf(0), c.q(0.01), c.q(0.99)]
df = pd.DataFrame.from_dict(rows, orient='index', columns=[
    'gross', 'mean ceded', 'share', 'Pr(no recovery)', 'q01', 'q99'])
df.index.name = 'gross year'
GT(df, float_format=',.1f', ratio_cols=['share'],
formatters={'Pr(no recovery)': '{x:.4f}'})| gross year | gross | mean ceded | share | Pr(no recovery) | q01 | q99 |
|---|---|---|---|---|---|---|
| median | 424 | 3.7 | 0.9% | 0.9180 | 0 | 88 |
| 1 in 10 | 904 | 153.0 | 16.9% | 0.1922 | 0 | 528 |
| 1 in 100 | 1,544 | 613.8 | 39.8% | 0.0015 | 88 | 920 |
| 1 in 1,000 | 2,104 | 958.9 | 45.6% | 0.0000 | 392 | 1,496 |
The method plot draws the per-claim pair on the left and the joint aggregate on the right, here with a log color scale and the axes cut to the bulk of the law. The per-claim pair is a line: nothing is ceded below 250 and every dollar above 250 is ceded. In the aggregate the recovery lies between zero and gross less 250, and the ridge at 750 holds the years whose only claim above 250 is at the 1,000 limit.
fig, (ax0, ax1) = figure('full', cols=2)
gc.plot(axs=(ax0, ax1), log=True)
ax0.set(xlim=[0, 1100], ylim=[0, 800])
ax1.set(xlim=[0, 2500], ylim=[0, 1500]);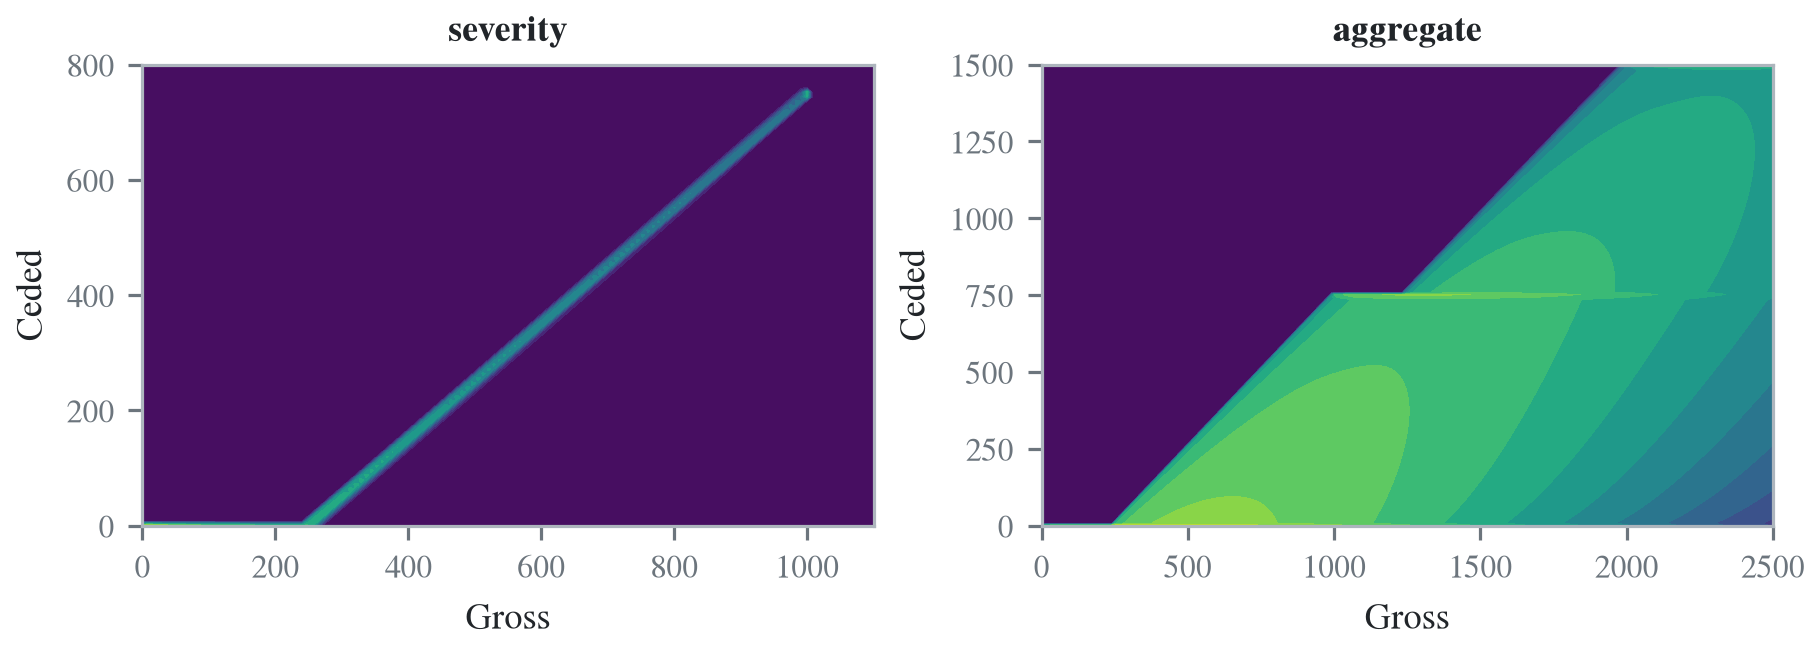
The pair grossnet shows how often a bad gross year is also a bad net year, which the two marginal distributions cannot show. Gross exceeds its 1 in 100 level, 1,544, in 1% of years, and in 36.1% of those years net exceeds its own 1 in 100 level, 1,080. The probability would be 1% if gross and net were independent and 100% if they were comonotone. Net loss is the sum of the claims capped at 250, so a net loss above 1,080 needs at least five claims, and a bad gross year made by one or two large claims is a moderate net year.
gn = pairs['grossnet']
qg, qn = gn.marginal('Gross').q(0.99), gn.marginal('Net').q(0.99)
d = gn.density_df
bad_gross = d.loc[d.index > qg].values.sum()
both = d.loc[d.index > qg, d.columns > qn].values.sum()
print(qg, qn, bad_gross, both / bad_gross)
1544.0 1080.0 0.009994323856094145 0.3608951908764983A view pair needs occurrence reinsurance to split, so a prefix on a plain agg is refused.
refuse('netceded agg Plain 10 claims 1000 xs 0 sev lognorm 50 cv 2 poisson')netceded requires occurrence reinsurance; none configured.